Fig. 5.
Download original image
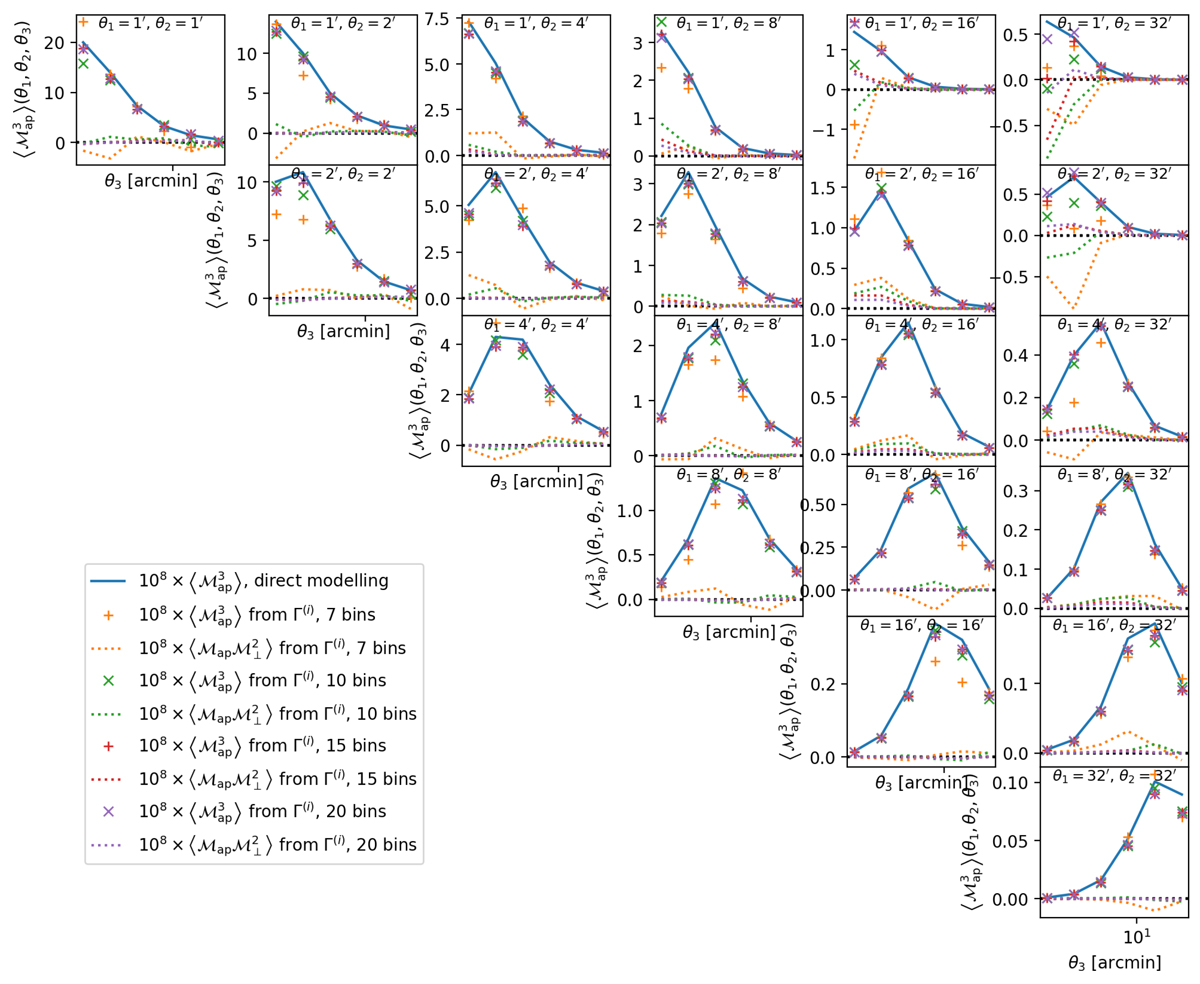
Third-order aperture mass statistics ![]() when modelled directly from the bispectrum (Eq. (31), blue line) compared to the ones constructed from modelled shear 3pcf (Eq. (35), coloured crosses). The dotted lines denote the respective B-modes. We plot
when modelled directly from the bispectrum (Eq. (31), blue line) compared to the ones constructed from modelled shear 3pcf (Eq. (35), coloured crosses). The dotted lines denote the respective B-modes. We plot ![]() (θ1, θ2, θ3), where θ1 is constant in each row, θ2 is constant in each column and θ3 varies along the x-axis in each panel. The yellow, green, red and purple dots denote the
(θ1, θ2, θ3), where θ1 is constant in each row, θ2 is constant in each column and θ3 varies along the x-axis in each panel. The yellow, green, red and purple dots denote the ![]() we get from the shear 3pcf when we bin r, u and v in 7 × 7 × 7, 10 × 10 × 10, 15 × 15 × 15 and 20 × 20 × 20 bins, respectively.
we get from the shear 3pcf when we bin r, u and v in 7 × 7 × 7, 10 × 10 × 10, 15 × 15 × 15 and 20 × 20 × 20 bins, respectively.
Current usage metrics show cumulative count of Article Views (full-text article views including HTML views, PDF and ePub downloads, according to the available data) and Abstracts Views on Vision4Press platform.
Data correspond to usage on the plateform after 2015. The current usage metrics is available 48-96 hours after online publication and is updated daily on week days.
Initial download of the metrics may take a while.