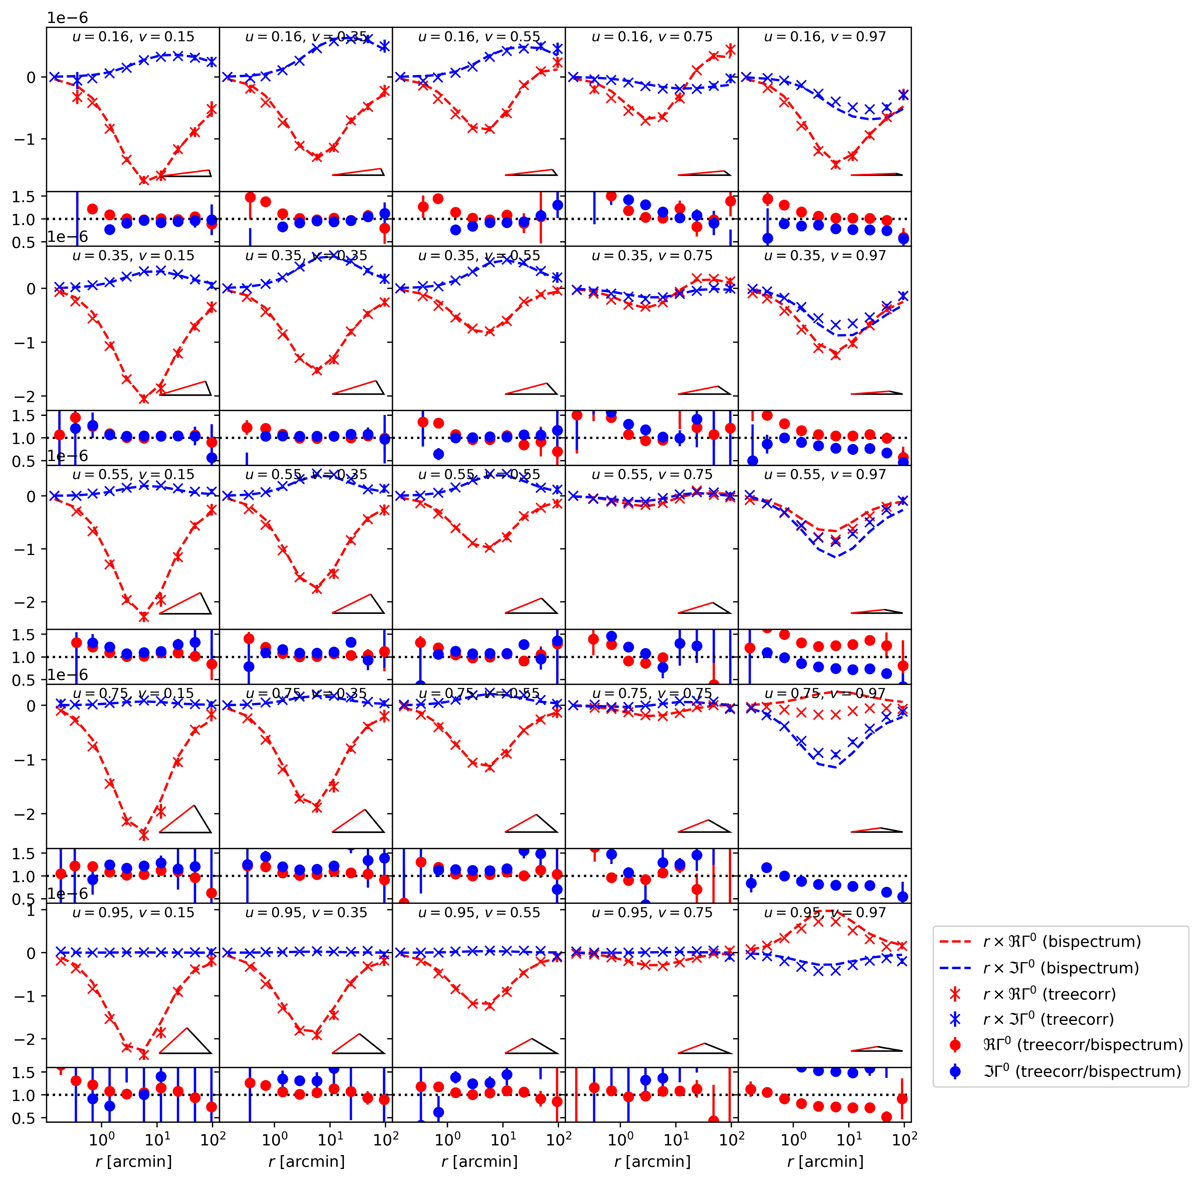
Fig. 4.
Download original image
First natural component Γ(0) of the shear three-point correlation functions modelled from B IHALOFIT compared to measurements from the MS that were extracted using TREECORR. Each panel corresponds to one fixed triangle configuration; the u and v values are listed at the top, and the corresponding shape of the triangle is shown on the bottom right. The x-axis corresponds to the length of the red side of the triangle. We show both the real part (red) and the imaginary part (blue) for the model (dashed line) and the simulations (crosses). Under each panel we show the ratio between measurement and model. The error bars denote the error on the mean of the 64 lines of sight of the MS.
Current usage metrics show cumulative count of Article Views (full-text article views including HTML views, PDF and ePub downloads, according to the available data) and Abstracts Views on Vision4Press platform.
Data correspond to usage on the plateform after 2015. The current usage metrics is available 48-96 hours after online publication and is updated daily on week days.
Initial download of the metrics may take a while.