Fig. B.1.
Download original image
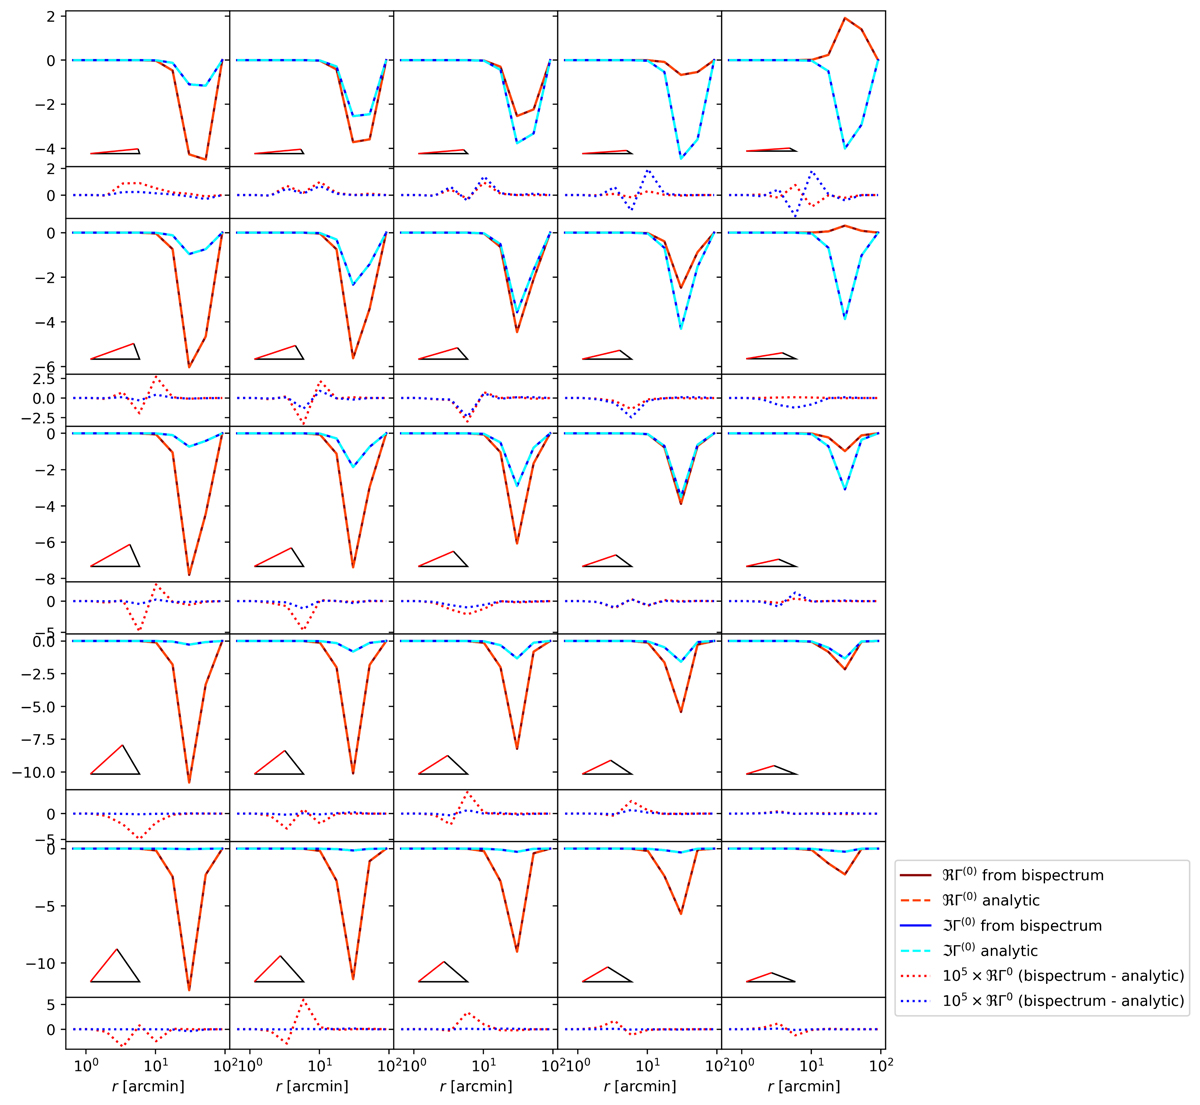
Real (red) and imaginary (blue) parts of the first natural component of the shear three-point correlation function Γ(0). Each plot panel corresponds to one fixed triangle shape shown in the bottom-right corner; the x-axis represents the length of the red triangle shape. We compare an integration of the analytic bispectrum model (B.9, dark solid) and the analytic solution (B.8, light dashed). Under each panel we show the difference between the integration and the analytic solution, multiplied by a factor of 105 for visibility.
Current usage metrics show cumulative count of Article Views (full-text article views including HTML views, PDF and ePub downloads, according to the available data) and Abstracts Views on Vision4Press platform.
Data correspond to usage on the plateform after 2015. The current usage metrics is available 48-96 hours after online publication and is updated daily on week days.
Initial download of the metrics may take a while.