Open Access
Fig. 1.
Download original image
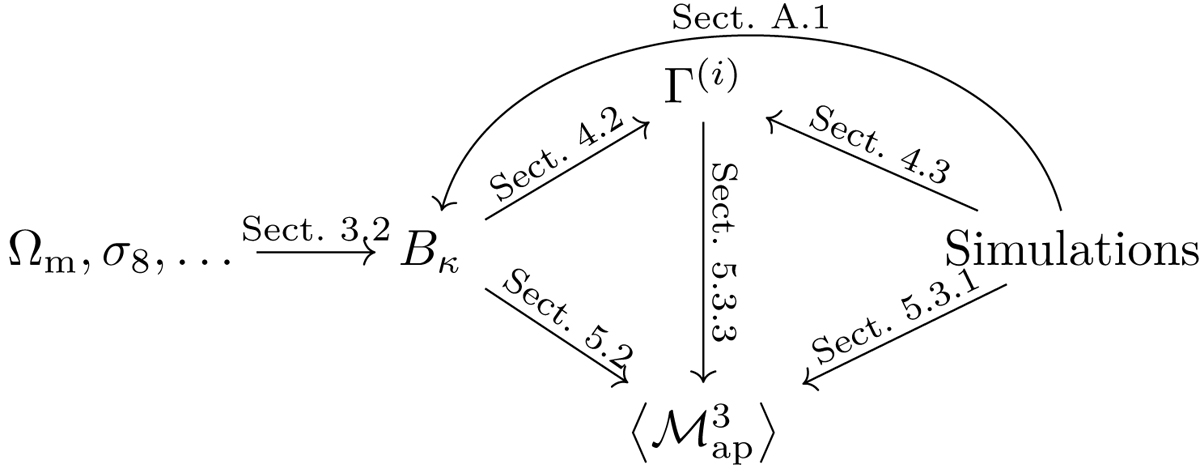
Schematic diagram of the modelling and validation pipeline introduced in this paper. The numbers on the arrows correspond to the respective section where this part of the pipeline is discussed.
Current usage metrics show cumulative count of Article Views (full-text article views including HTML views, PDF and ePub downloads, according to the available data) and Abstracts Views on Vision4Press platform.
Data correspond to usage on the plateform after 2015. The current usage metrics is available 48-96 hours after online publication and is updated daily on week days.
Initial download of the metrics may take a while.