Fig. 7
Download original image
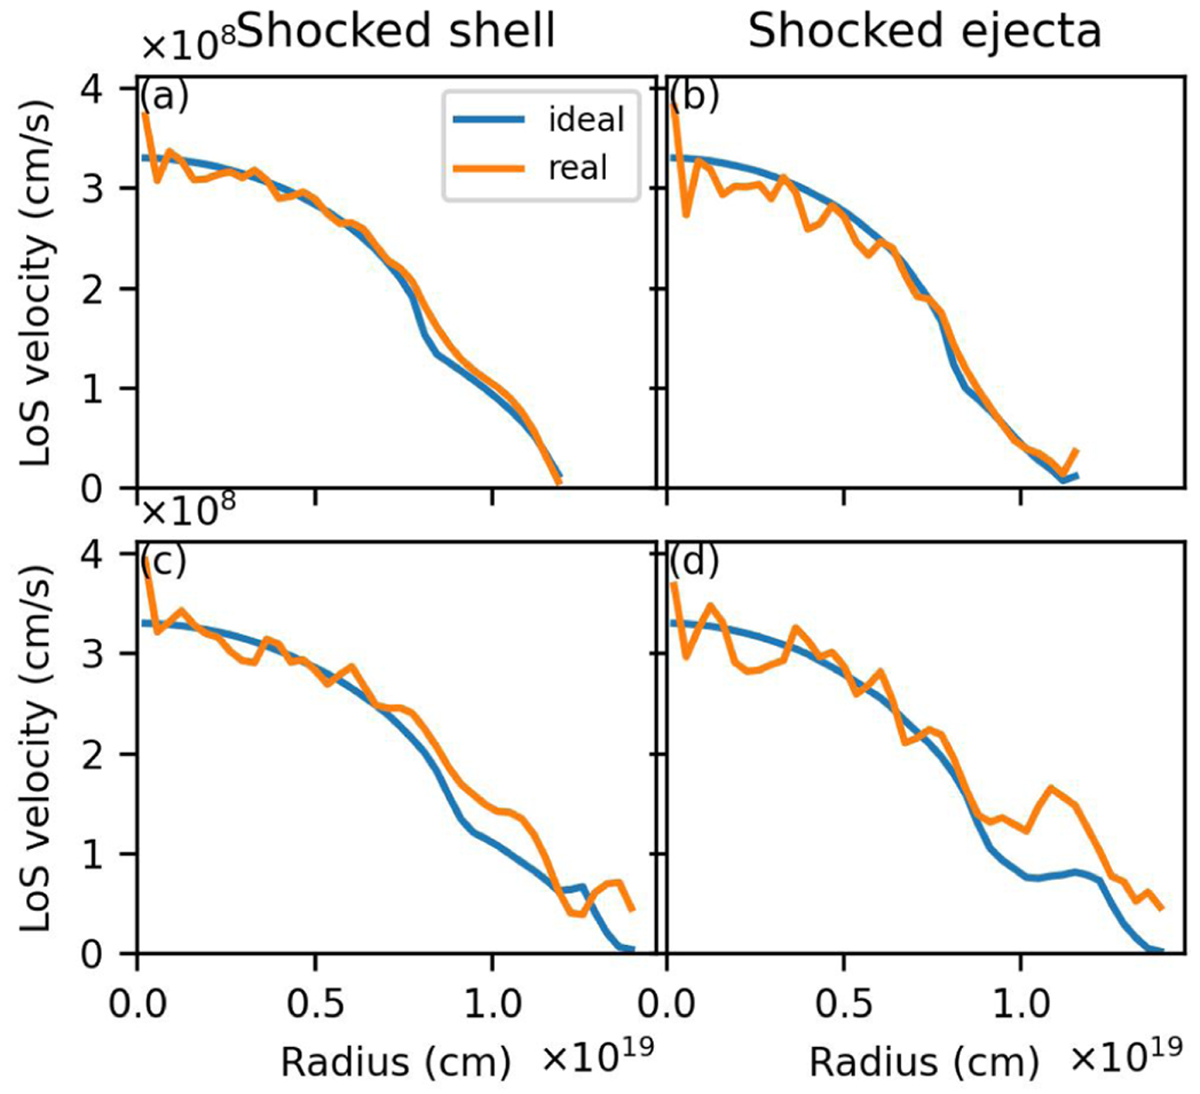
Line-of-sight (LoS) velocity 450 yr after SN explosion. The average density-weighted LoS velocity is displayed both for the nonturbulent (a, b) and turbulent (c, d) cases. The calculation of the LoS velocity uses either the shocked shell contained between BW and RS (a, c) or the shocked ejecta contained between CD and RS (b, d). Both idealised values (blue) and simulated values (orange) of the velocity and density are considered for the calculation.
Current usage metrics show cumulative count of Article Views (full-text article views including HTML views, PDF and ePub downloads, according to the available data) and Abstracts Views on Vision4Press platform.
Data correspond to usage on the plateform after 2015. The current usage metrics is available 48-96 hours after online publication and is updated daily on week days.
Initial download of the metrics may take a while.