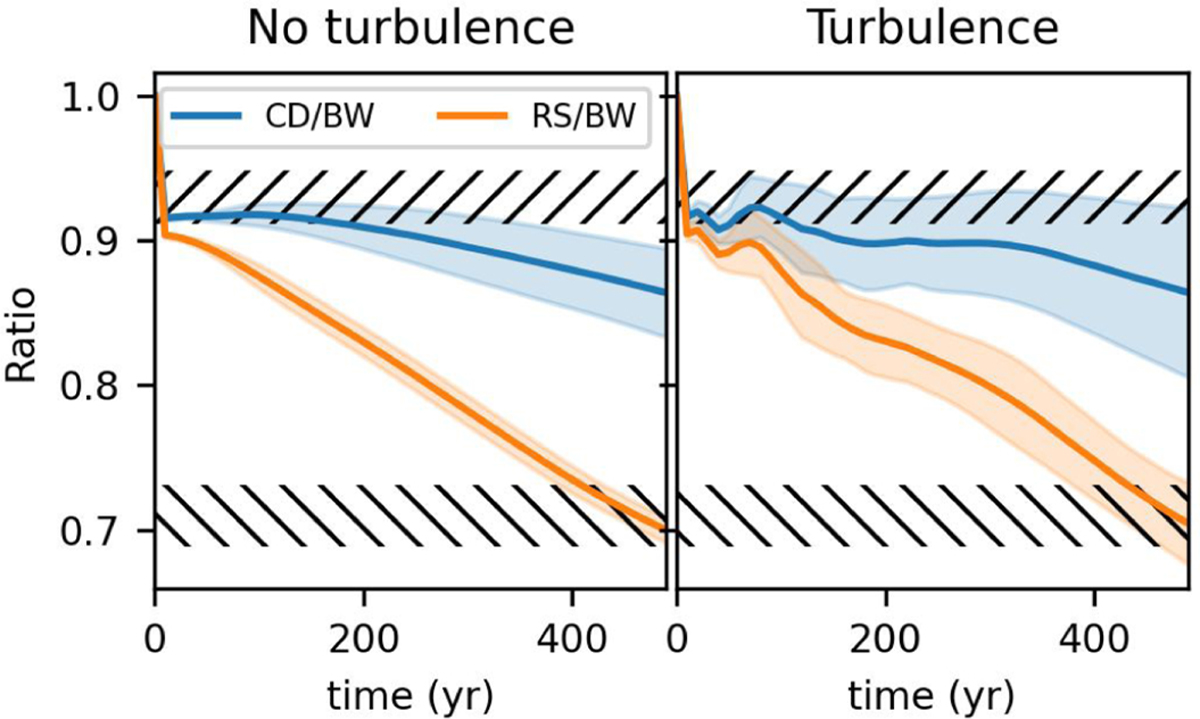
Fig. 5
Download original image
Time evolution of the various ratios of BW, CD, and RS radii. The temporal evolution of the CD (blue) and RS (orange) radii normalised by the BW radius is displayed for 500 yr both for the simulation without (left) and with (right) turbulence. The plain curve corresponds to the average over all solid angles of the distribution of the ratio of the radii, and the coloured zones to their standard deviation. The hatched areas correspond to the radius ratios as observed in Warren et al. (2005).
Current usage metrics show cumulative count of Article Views (full-text article views including HTML views, PDF and ePub downloads, according to the available data) and Abstracts Views on Vision4Press platform.
Data correspond to usage on the plateform after 2015. The current usage metrics is available 48-96 hours after online publication and is updated daily on week days.
Initial download of the metrics may take a while.