Fig. 4
Download original image
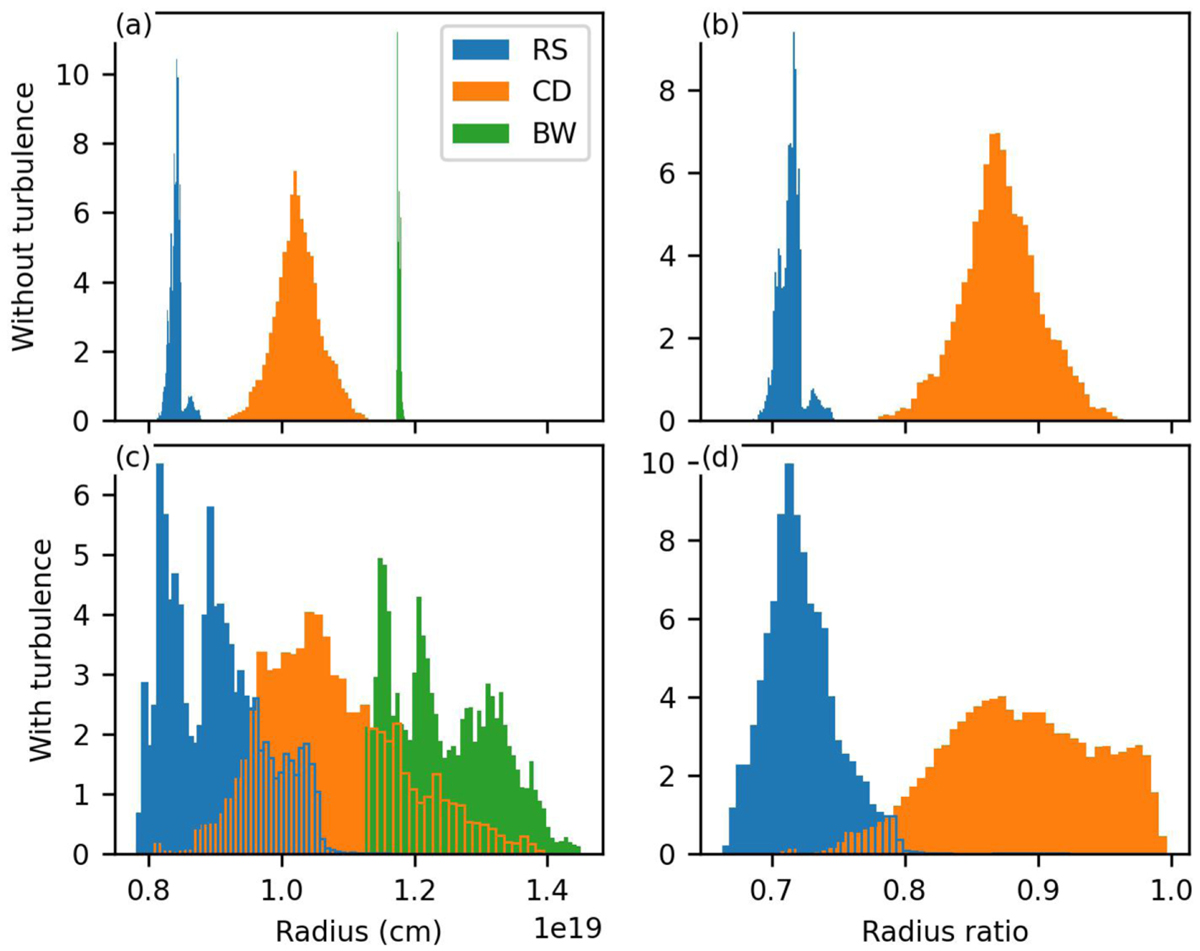
Spatial distribution of the SNR radius. Histogram of the RS (blue), CD (orange), BW (green) radius both without (a) and with (c) turbulence obtained 450 yr after SN explosion (simulations displayed in Fig. 1). To compensate for the spatial variation of the BW radius appearing in the turbulent case, the RS and CD radii are normalised using their respective BW radius for each solid angle both without (b) and with (d) turbulence.
Current usage metrics show cumulative count of Article Views (full-text article views including HTML views, PDF and ePub downloads, according to the available data) and Abstracts Views on Vision4Press platform.
Data correspond to usage on the plateform after 2015. The current usage metrics is available 48-96 hours after online publication and is updated daily on week days.
Initial download of the metrics may take a while.