Fig. B.5
Download original image
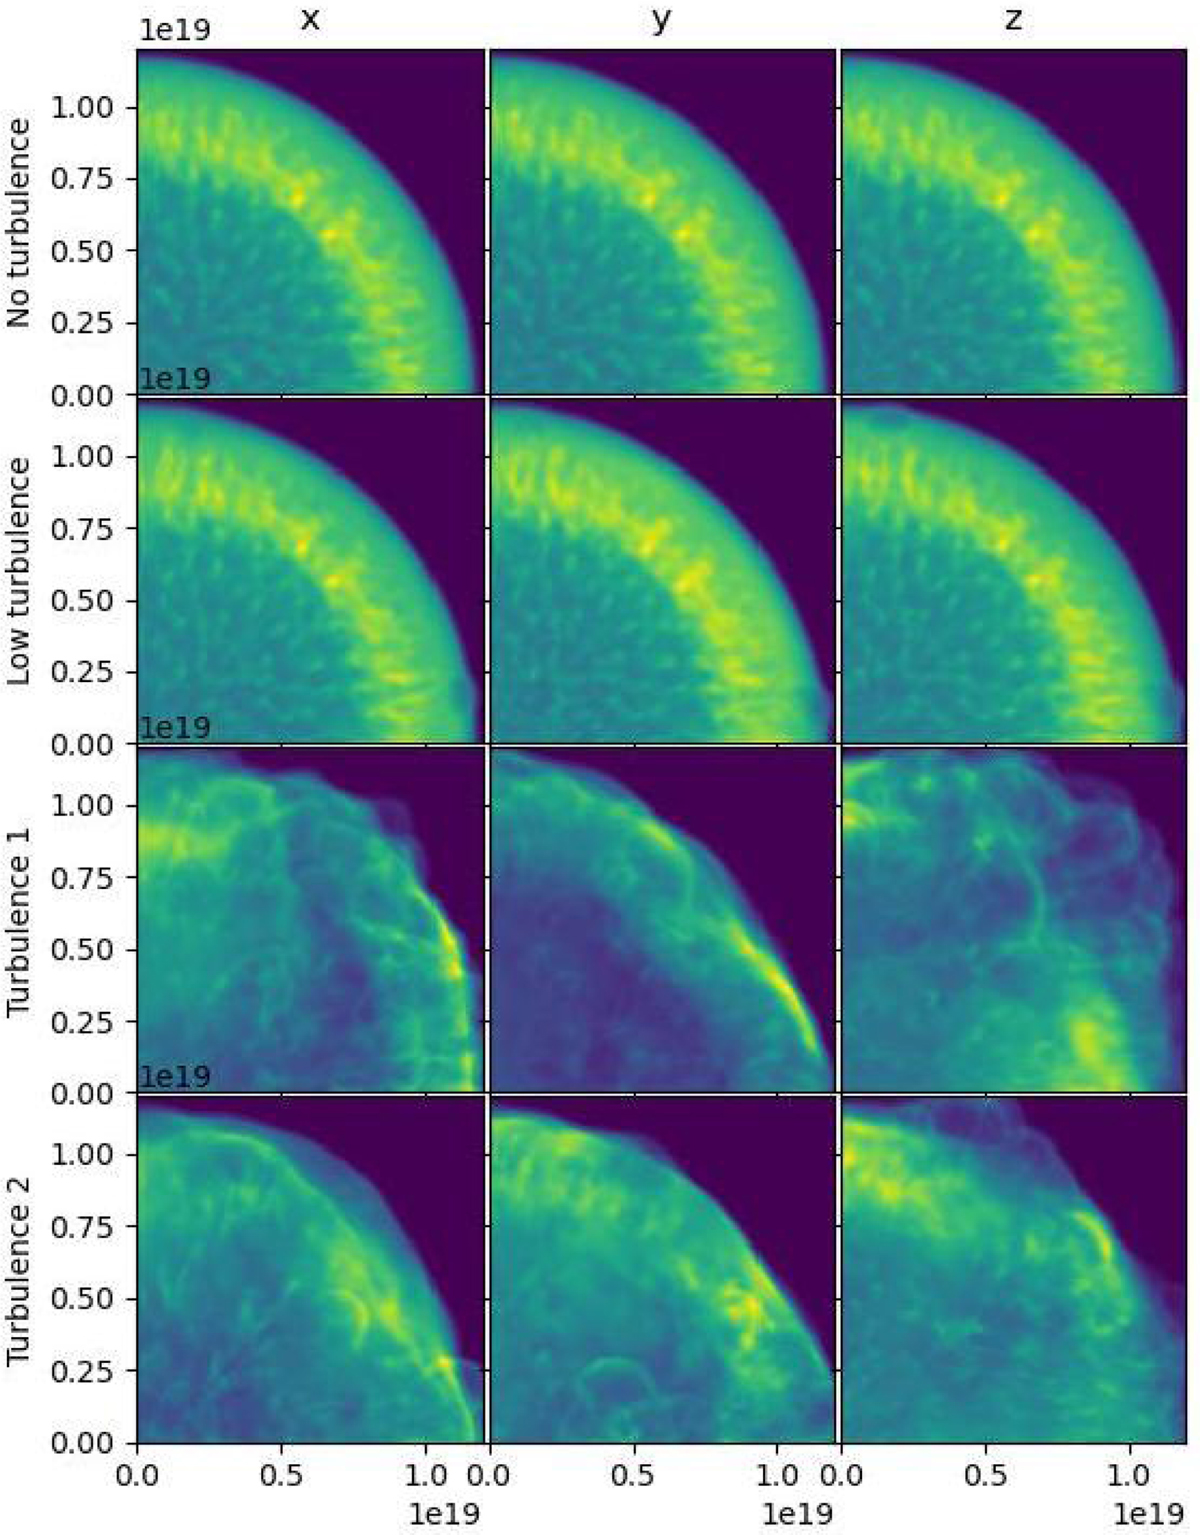
Density projection. Projection of the density of the SNR (ejecta and shocked ISM) according to the three spatial axes (columns) taken 450 yr after SNR explosion. Here, four different situations are represented (one per line). The ‘no turbulence’ case corresponds to the simulation with a uniform ISM. The ‘low turbulence’ case includes turbulence and uses the lower-σ value (0.05). This case does not differ significantly from the ‘no turbulence’ one. Both ‘turbulence 1’ and ‘turbulence 2’ employ a turbulent ISM with σ = 0.5, but each uses a different set of random phases. The BW appears wavy in these cases, which is closer to the morphology of the BW observed in Tycho.
Current usage metrics show cumulative count of Article Views (full-text article views including HTML views, PDF and ePub downloads, according to the available data) and Abstracts Views on Vision4Press platform.
Data correspond to usage on the plateform after 2015. The current usage metrics is available 48-96 hours after online publication and is updated daily on week days.
Initial download of the metrics may take a while.