Open Access
Fig. D.1
Download original image
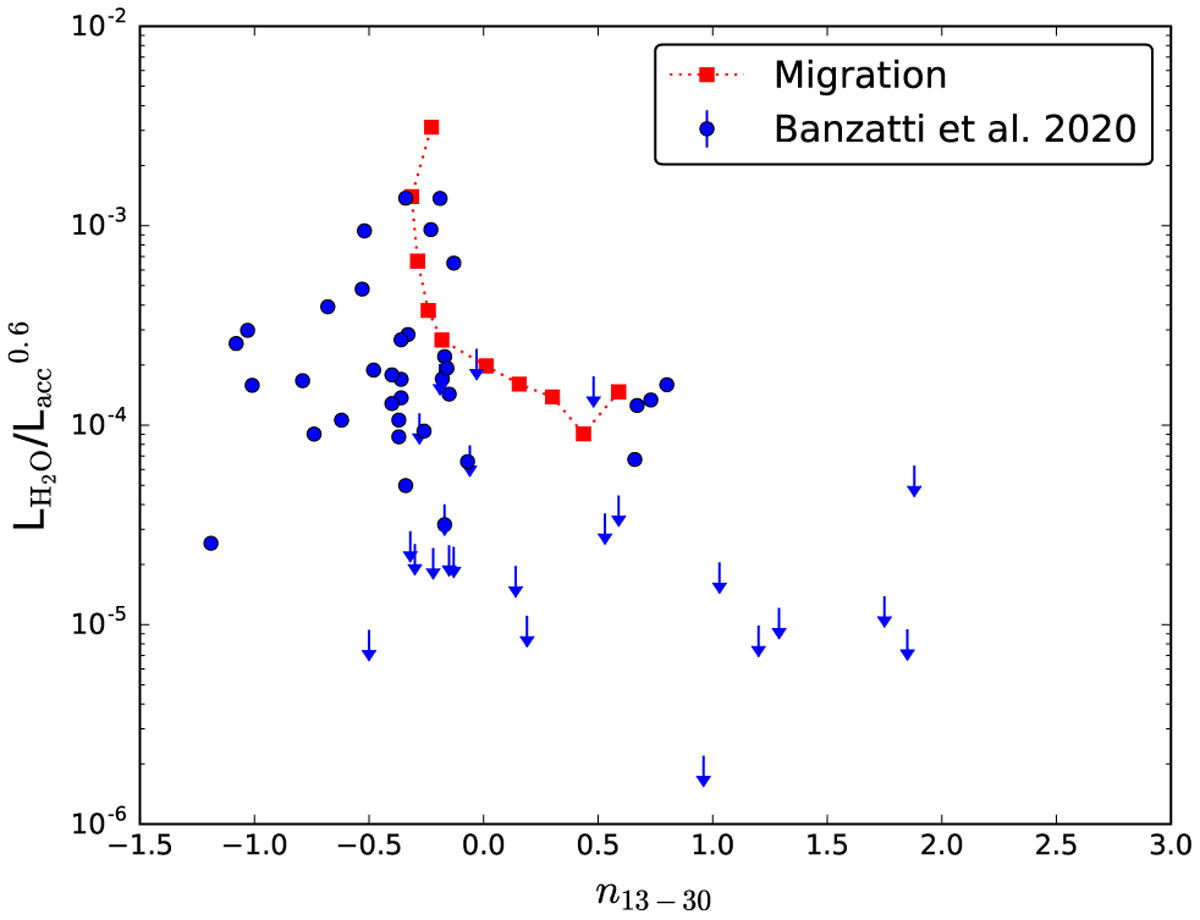
Accretion-normalised MIR water luminosity versus the n13–30 continuum spectral index. Blue dots and arrows (upper limits) are observations taken from Table 2 and 3 of Banzatti et al. (2020). Red squares are the values from the dust evolutionary models of Greenwood et al. (2019a)
Current usage metrics show cumulative count of Article Views (full-text article views including HTML views, PDF and ePub downloads, according to the available data) and Abstracts Views on Vision4Press platform.
Data correspond to usage on the plateform after 2015. The current usage metrics is available 48-96 hours after online publication and is updated daily on week days.
Initial download of the metrics may take a while.