Fig. 1
Download original image
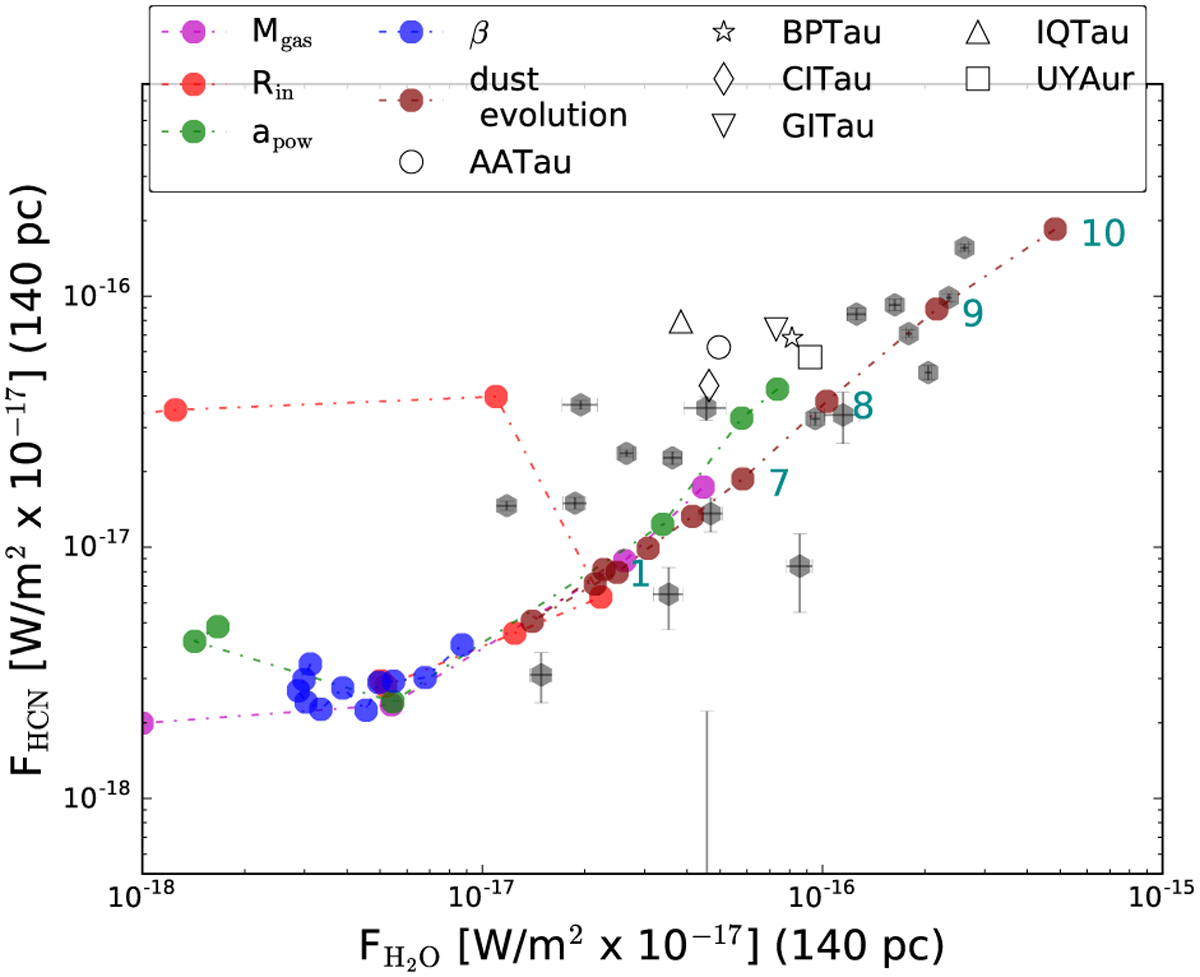
Observed HCN versus H2O MIR blend fluxes from Najita et al. (2013) with error bars (grey hexagons), scaled to a distance of 140 pc using Gaia parallaxes (https://gea.esac.esa.int/archive/). The model series for disk gas mass (magenta circles), disk inner radius (red circles), dust power law index (green circles), disk flaring index (blue circles) from Antonellini et al. (2015, 2016), and dust evolution from Greenwood et al. (2019b; brown circles) are over-plotted. Some of the dust evolution models are labelled in dark cyan, with the number indicating the model time step. Observed objects deviating from the trend of the dust evolution model series are plotted as open symbols and are named in the legend.
Current usage metrics show cumulative count of Article Views (full-text article views including HTML views, PDF and ePub downloads, according to the available data) and Abstracts Views on Vision4Press platform.
Data correspond to usage on the plateform after 2015. The current usage metrics is available 48-96 hours after online publication and is updated daily on week days.
Initial download of the metrics may take a while.