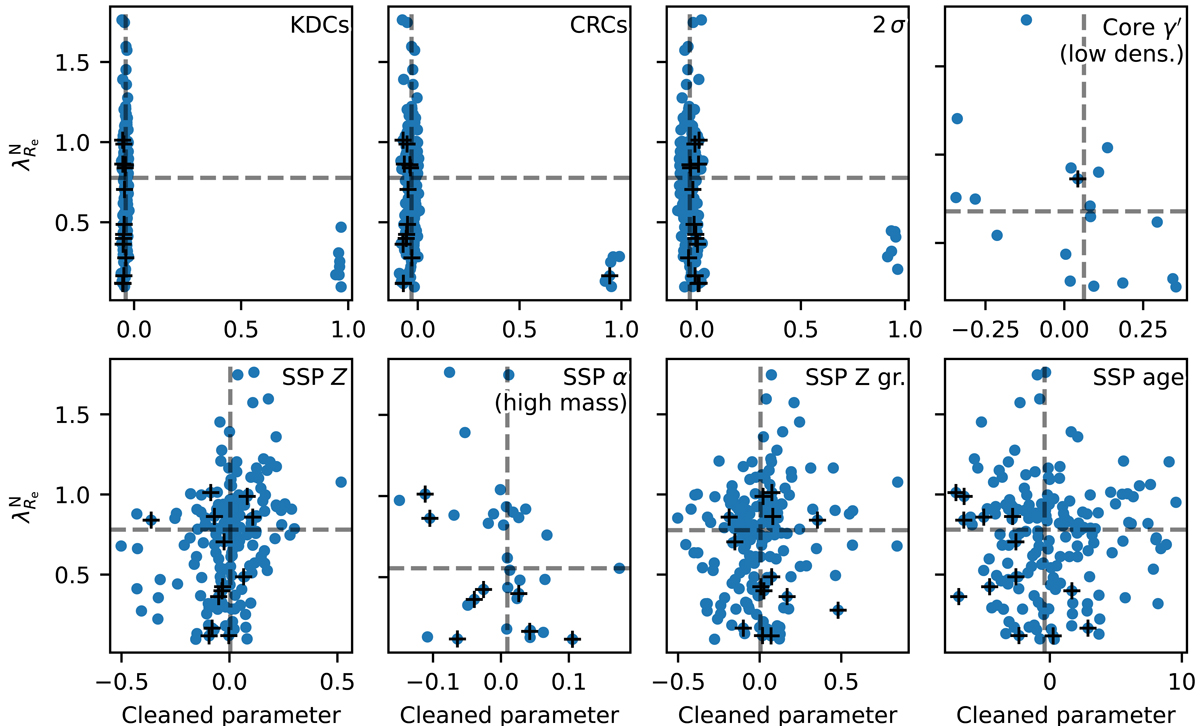
Fig. 2.
Download original image
Demonstration that the significant correlations between the rotational support and the merger-sensitive parameters detected above were not caused by recent major mergers. All galaxies from the sample are shown as points, while the candidates for the recent major merger remnants are highlighted by crosses. The horizontal coordinate of each panel shows the cleaned value of the given parameter. The vertical axis shows the rotational support. The dashed lines indicate the median values calculated for all available data.
Current usage metrics show cumulative count of Article Views (full-text article views including HTML views, PDF and ePub downloads, according to the available data) and Abstracts Views on Vision4Press platform.
Data correspond to usage on the plateform after 2015. The current usage metrics is available 48-96 hours after online publication and is updated daily on week days.
Initial download of the metrics may take a while.