Fig. 7.
Download original image
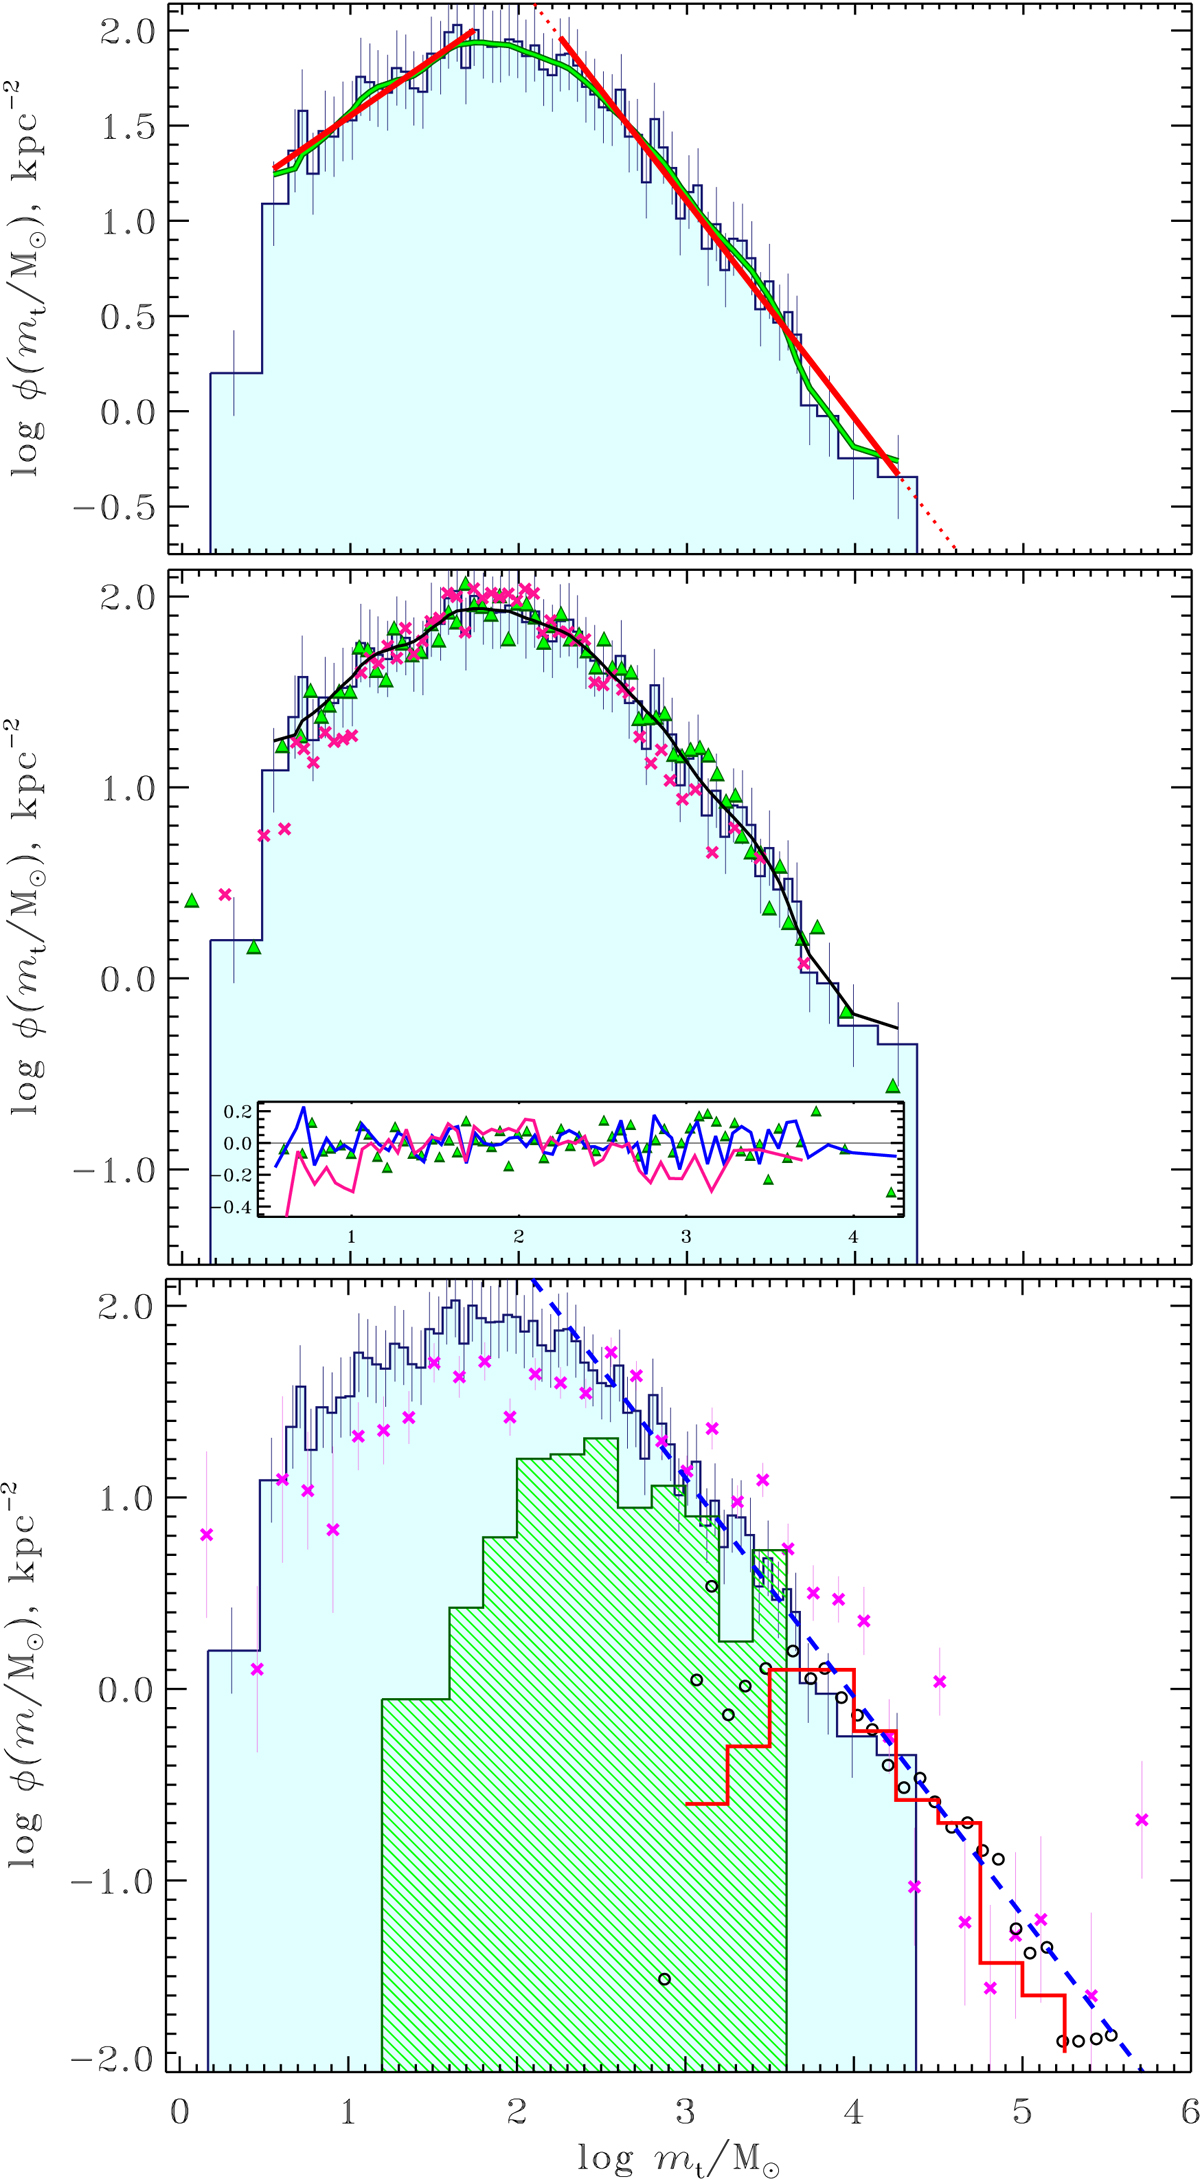
GCMF computed with magnitude-dependent completeness limits in Eq. (12), (light-blue filled histogram). Vertical bars show errors mainly due to uncertainty in mass. Top panel shows the low- and high-mass power-law fits (solid red lines) and the smoothed histogram data (green line). The middle panel presents different approaches to the mass function construction: single completeness limit with ![]() kpc (magenta crosses); local tidal mass (green triangles). The inset shows deviations from the smoothed data. Bottom panel presents a comparison with the literature CMFs: COCD-based for the Milky Way by Lamers et al. (2005, hatched histogram) and Piskunov et al. (2008, crosses); for LMC star clusters by Larsen (2009, open red histogram); for M83 by Fouesneau et al. (2012, open circles). The extragalactic CMFs are adjusted vertically for comparison. The dashed line shows the high-mass slope from the top panel.
kpc (magenta crosses); local tidal mass (green triangles). The inset shows deviations from the smoothed data. Bottom panel presents a comparison with the literature CMFs: COCD-based for the Milky Way by Lamers et al. (2005, hatched histogram) and Piskunov et al. (2008, crosses); for LMC star clusters by Larsen (2009, open red histogram); for M83 by Fouesneau et al. (2012, open circles). The extragalactic CMFs are adjusted vertically for comparison. The dashed line shows the high-mass slope from the top panel.
Current usage metrics show cumulative count of Article Views (full-text article views including HTML views, PDF and ePub downloads, according to the available data) and Abstracts Views on Vision4Press platform.
Data correspond to usage on the plateform after 2015. The current usage metrics is available 48-96 hours after online publication and is updated daily on week days.
Initial download of the metrics may take a while.