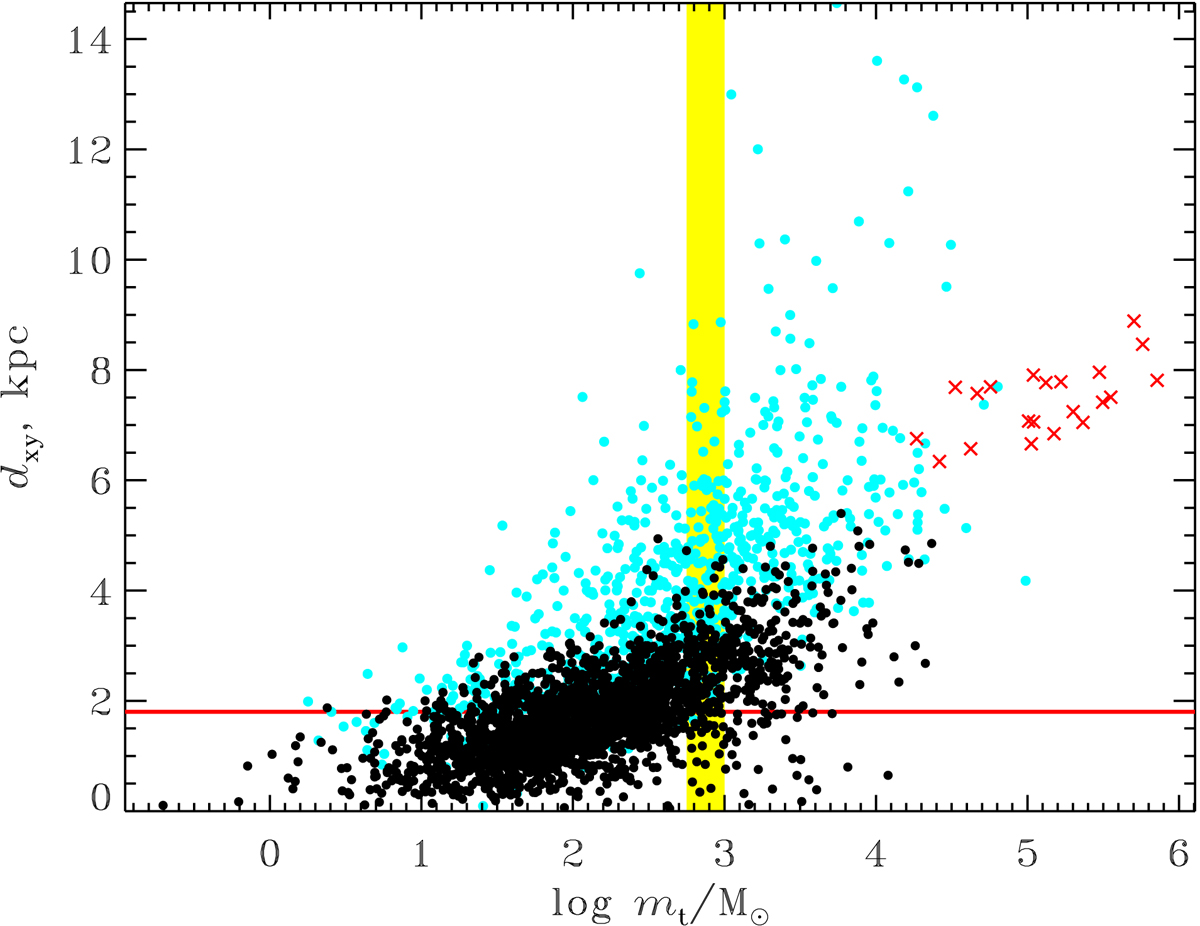
Fig. 6.
Download original image
Distribution of cluster distances with mass. The clusters located inside and outside the magnitude-dependent completeness limits computed in Eq. (7) are shown with black and light blue dots, respectively. The single completeness limit for the MWSC sample is given by the horizontal red line. A vertical yellow stripe is given for illustration and indicates an arbitrary log mt-box with clusters of the two kinds falling in it. Red crosses show ‘central’ (R ≤ 3 kpc) clusters excluded from further consideration.
Current usage metrics show cumulative count of Article Views (full-text article views including HTML views, PDF and ePub downloads, according to the available data) and Abstracts Views on Vision4Press platform.
Data correspond to usage on the plateform after 2015. The current usage metrics is available 48-96 hours after online publication and is updated daily on week days.
Initial download of the metrics may take a while.