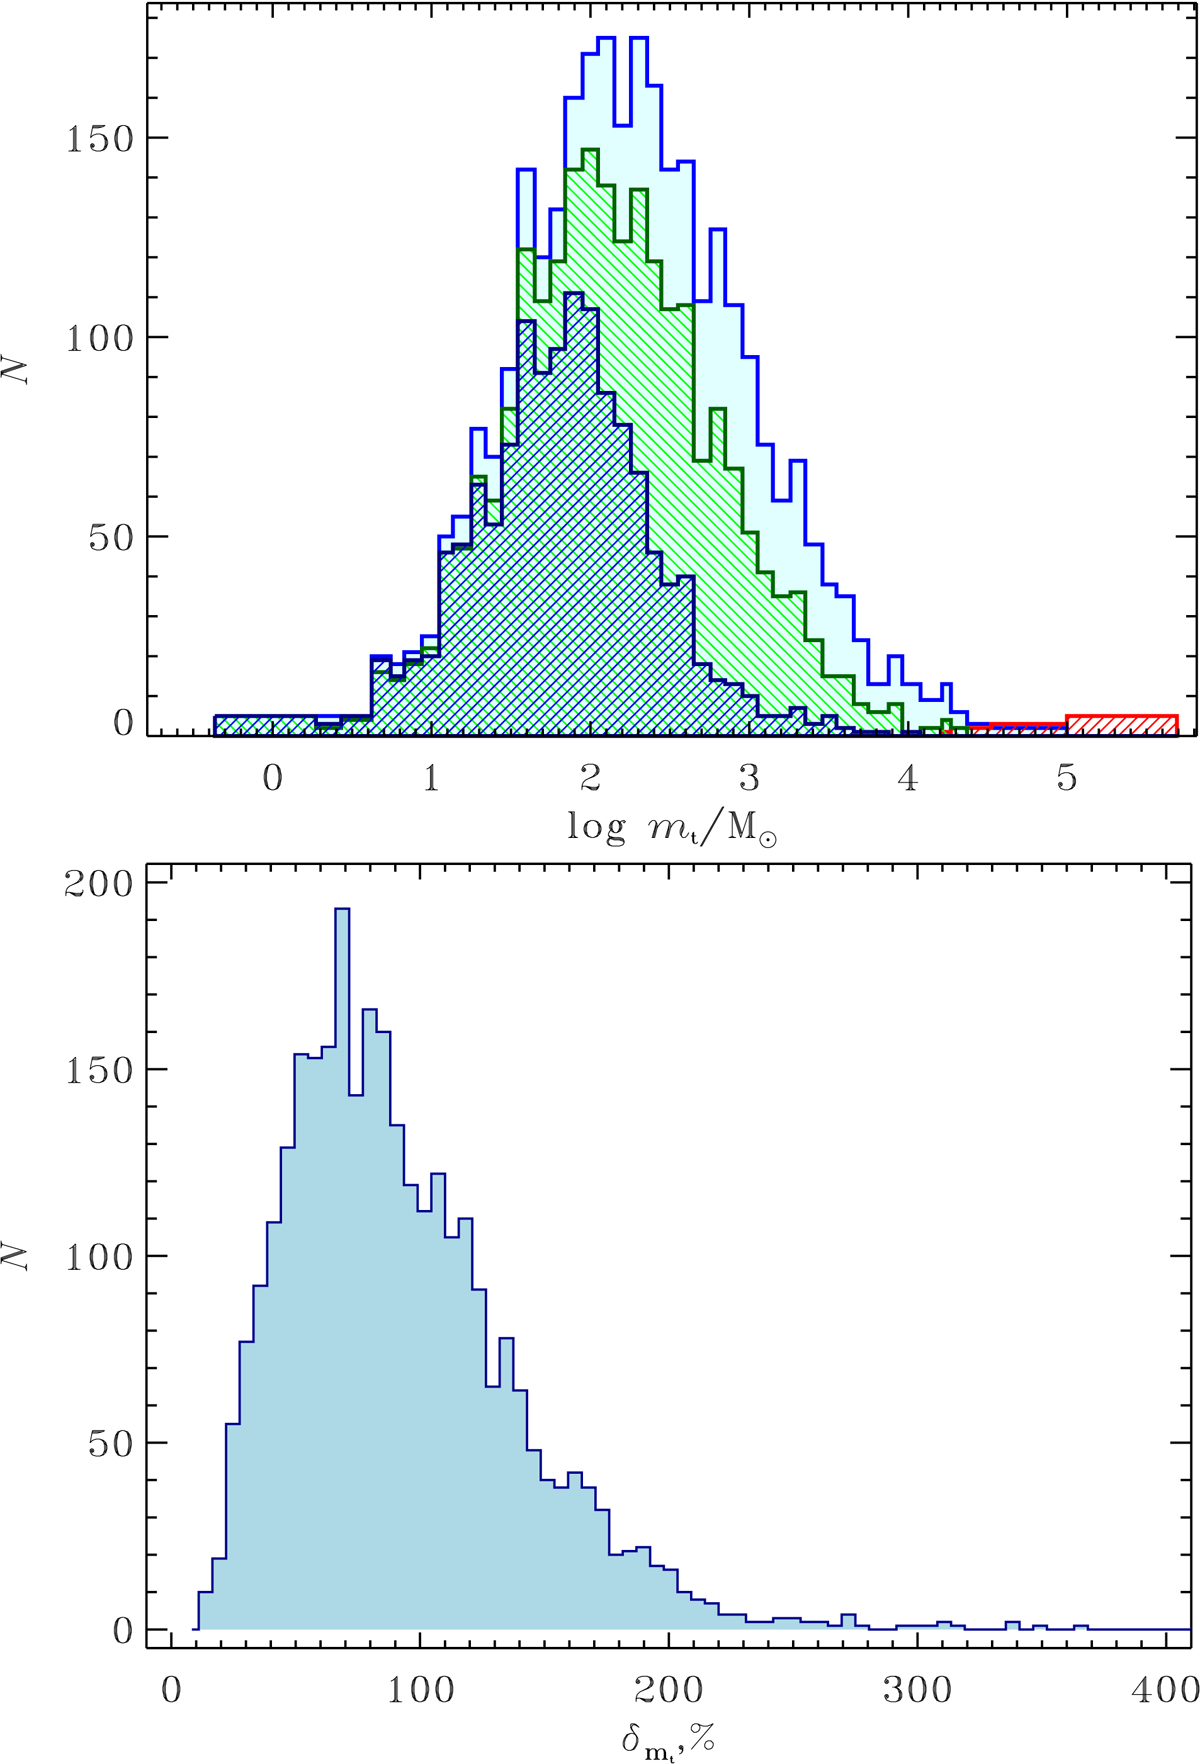
Fig. 5.
Download original image
Raw distributions of MWSC clusters with tidal mass (top panel) and with its relative error (bottom panel). Different histograms in the top panel correspond to different cluster samples. The total sample is shown in the background with a solid cyan histogram, the clusters selected within the single completeness circle are shown with a histogram hatched with blue (foreground) and those within their magnitude-dependent completeness limits are shown with a back-hatched green histogram (in between). The red-colour massive end of the distribution is built of ‘central’ (R ≤ 3 kpc) clusters.
Current usage metrics show cumulative count of Article Views (full-text article views including HTML views, PDF and ePub downloads, according to the available data) and Abstracts Views on Vision4Press platform.
Data correspond to usage on the plateform after 2015. The current usage metrics is available 48-96 hours after online publication and is updated daily on week days.
Initial download of the metrics may take a while.