Open Access
Fig. 11.
Download original image
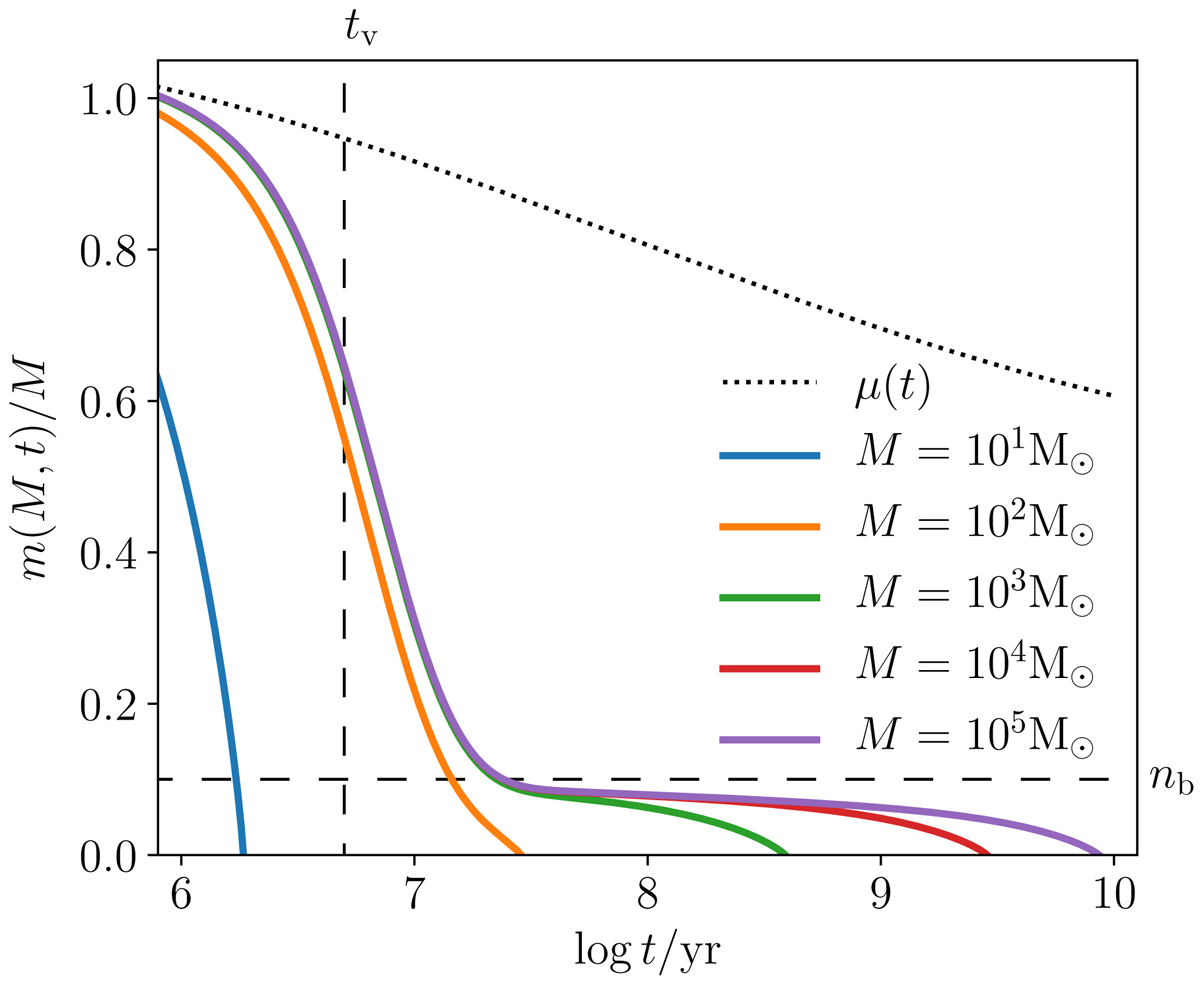
Evolution of the modelled mass fraction for clusters of different initial masses. The mass loss just from stellar evolution, μ(t), is shown in addition for comparison. The horizontal dashed line marks the bound fraction, nb, after violent relaxation and the vertical dashed line marks the violent relaxation timescale, tv.
Current usage metrics show cumulative count of Article Views (full-text article views including HTML views, PDF and ePub downloads, according to the available data) and Abstracts Views on Vision4Press platform.
Data correspond to usage on the plateform after 2015. The current usage metrics is available 48-96 hours after online publication and is updated daily on week days.
Initial download of the metrics may take a while.