Fig. 8.
Download original image
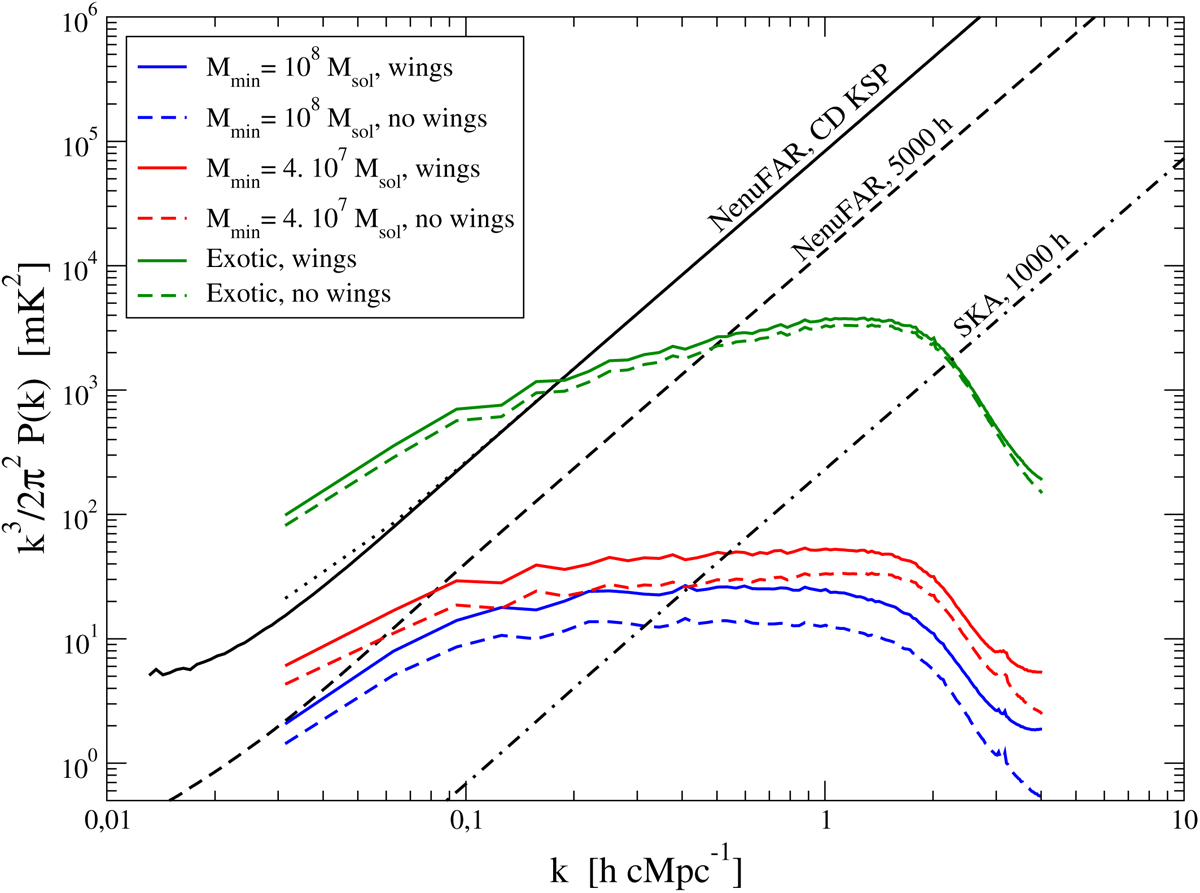
3D isotropic power spectra of the 21-cm signal at z = 16.5 for three different models (see the main text for further details) plotted for two different ways of modelling the Lyman-α coupling (both without the contribution of gas velocities) and compared to the expected thermal noise of observations on the NenuFAR and SKA radio interferometers. The dotted black line shows the contribution from sample variance in the case of the exotic signal.
Current usage metrics show cumulative count of Article Views (full-text article views including HTML views, PDF and ePub downloads, according to the available data) and Abstracts Views on Vision4Press platform.
Data correspond to usage on the plateform after 2015. The current usage metrics is available 48-96 hours after online publication and is updated daily on week days.
Initial download of the metrics may take a while.