Fig. 5.
Download original image
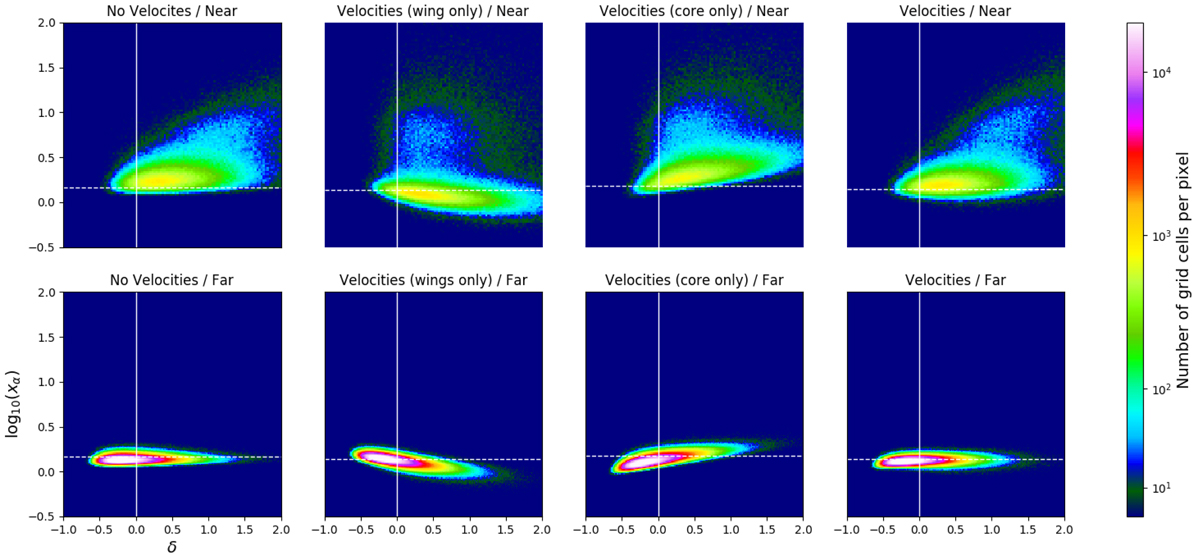
2D histograms of the number of grid cells as a function of overdensity and log10(xα). The upper row was computed including only cells that are located less than 1.2 cMpc from a source. The low row was computed including only cells that are located more than 6 cMpc away from any source. The different column corresponds to different modelling methods (the same as in Fig. 4).
Current usage metrics show cumulative count of Article Views (full-text article views including HTML views, PDF and ePub downloads, according to the available data) and Abstracts Views on Vision4Press platform.
Data correspond to usage on the plateform after 2015. The current usage metrics is available 48-96 hours after online publication and is updated daily on week days.
Initial download of the metrics may take a while.