Open Access
Fig. 3.
Download original image
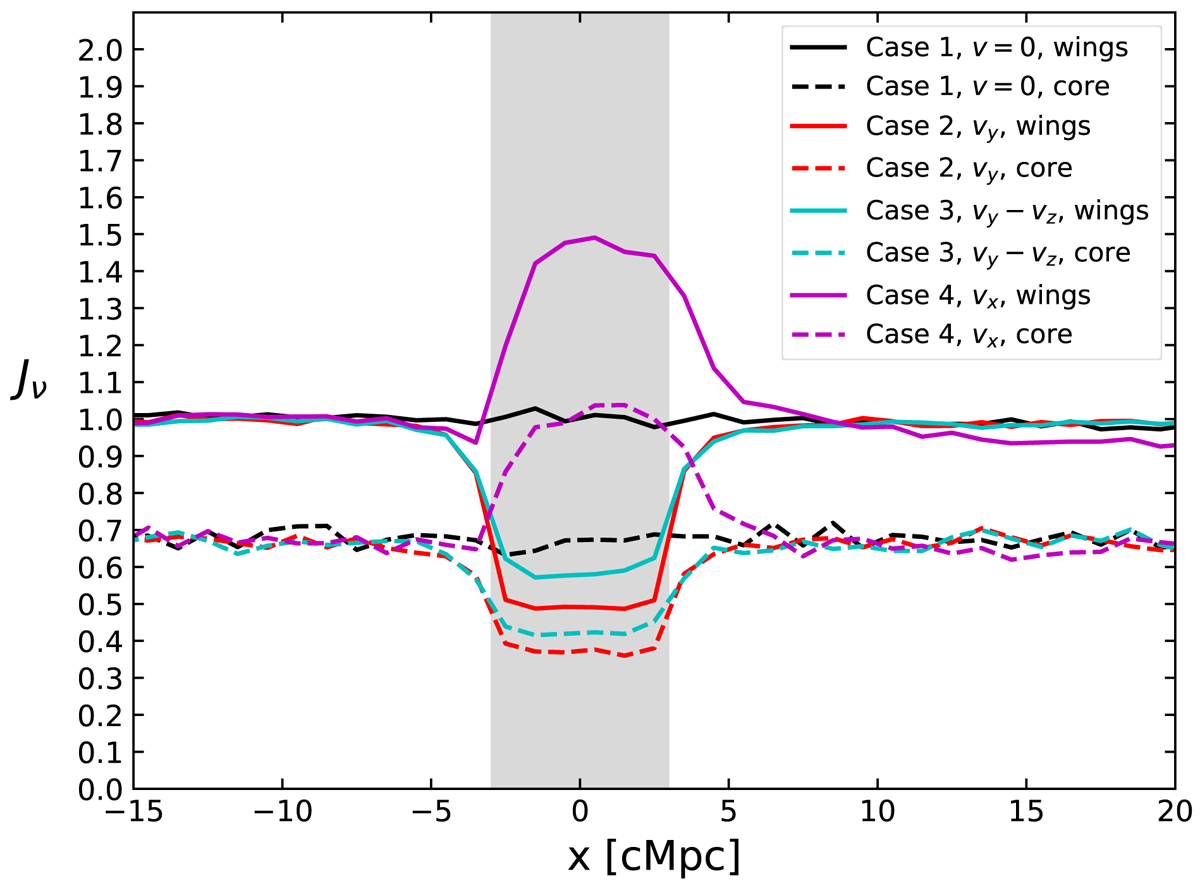
Spatial fluctuations of the angle-averaged specific intensity at the centre of the Lyman-α line and in the wings for all four cases described in the main text, characterised by different velocity fields in the shaded slab. These correspond to horizontal cuts in Fig. 1.
Current usage metrics show cumulative count of Article Views (full-text article views including HTML views, PDF and ePub downloads, according to the available data) and Abstracts Views on Vision4Press platform.
Data correspond to usage on the plateform after 2015. The current usage metrics is available 48-96 hours after online publication and is updated daily on week days.
Initial download of the metrics may take a while.