Fig. 1.
Download original image
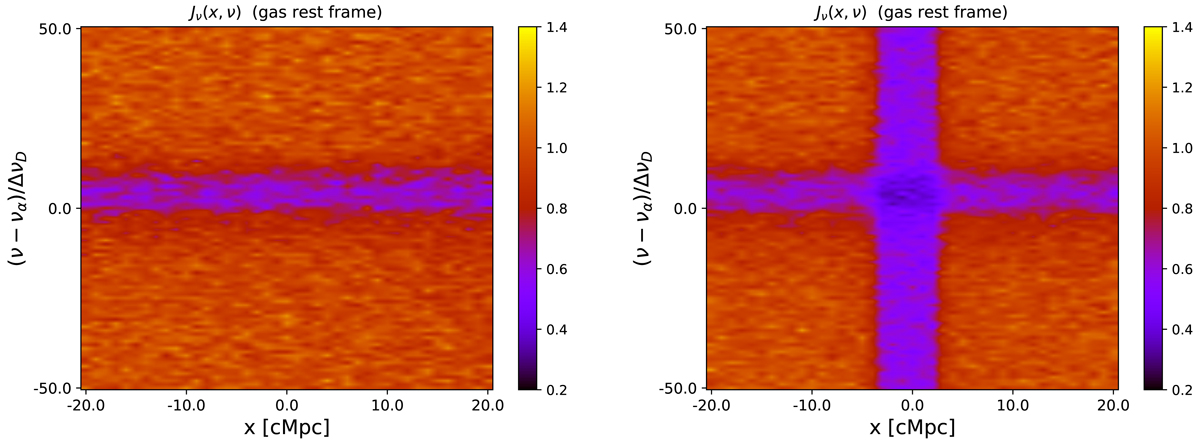
Angle-averaged specific intensity near the Lyman-α line centre as a function of the position and frequency in two idealised setups described in the main text as case 1 (left panel) and case 3 (right panel). The angle-averaged specific intensity is normalised to 1 far from the line centre and where there are no effects from velocities.
Current usage metrics show cumulative count of Article Views (full-text article views including HTML views, PDF and ePub downloads, according to the available data) and Abstracts Views on Vision4Press platform.
Data correspond to usage on the plateform after 2015. The current usage metrics is available 48-96 hours after online publication and is updated daily on week days.
Initial download of the metrics may take a while.