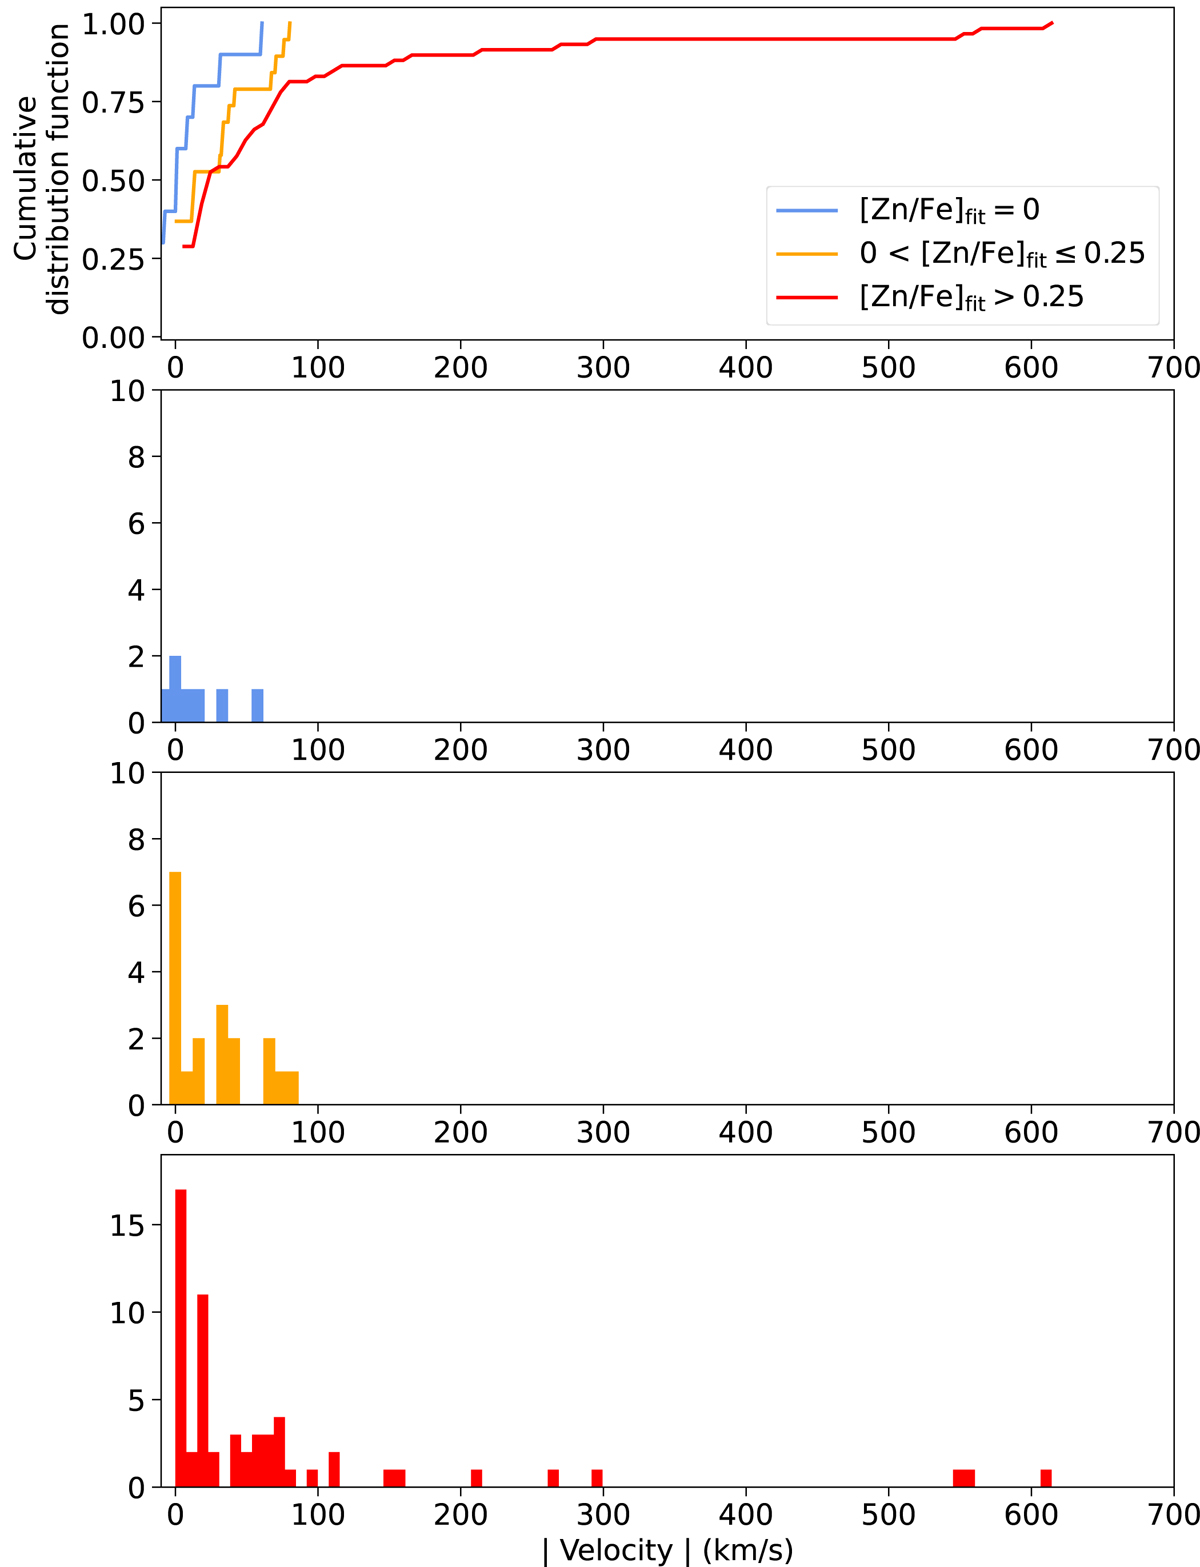
Fig. 16.
Download original image
Absolute value velocity distribution for all components. Here we make a distinction between zero depletion, and low- and higher-depletion components at a [Zn/Fe]fit value of 0.25. The top panel shows the cumulative distributions for all three distribution. The following three panels show histograms for zero, low- and high-depletion components respectively. We see a similar distribution for the proximate DLAs.
Current usage metrics show cumulative count of Article Views (full-text article views including HTML views, PDF and ePub downloads, according to the available data) and Abstracts Views on Vision4Press platform.
Data correspond to usage on the plateform after 2015. The current usage metrics is available 48-96 hours after online publication and is updated daily on week days.
Initial download of the metrics may take a while.