Fig. 1.
Download original image
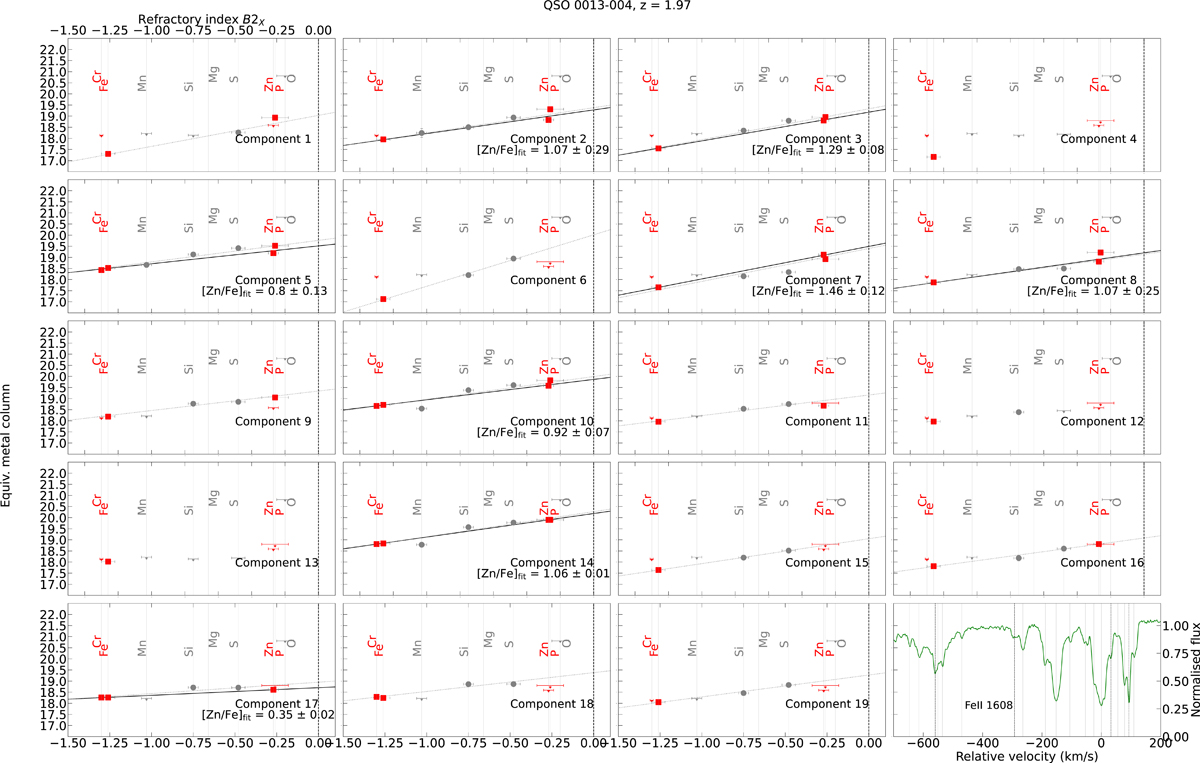
The depletion pattern and fitted straight lines to DLA system QSO 0013−004 with at least 19 individual gas components. Components are numbered increasingly with increasing velocities (i.e., number one being the bluest component). Here the solid black line shows the linear fit to the depletion pattern for only the non-α elements Cr, Fe, Zn, P (in red squares). The depletion factor [Zn/Fe]fit is the slope of the fit. The dotted line shows the linear fit to the depletion patterns when all the available metals are included. The dashed vertical line is where B2X = 0. The last panel shows the spectrum of the quasar, and indicates the positions of the individual components as determined with a Voigt-profile fitting technique. We see diversity in the depletion strengths of the components. The dashed black line shows the components in which H2 is detected by Petitjean et al. (2002).
Current usage metrics show cumulative count of Article Views (full-text article views including HTML views, PDF and ePub downloads, according to the available data) and Abstracts Views on Vision4Press platform.
Data correspond to usage on the plateform after 2015. The current usage metrics is available 48-96 hours after online publication and is updated daily on week days.
Initial download of the metrics may take a while.