Fig. 9.
Download original image
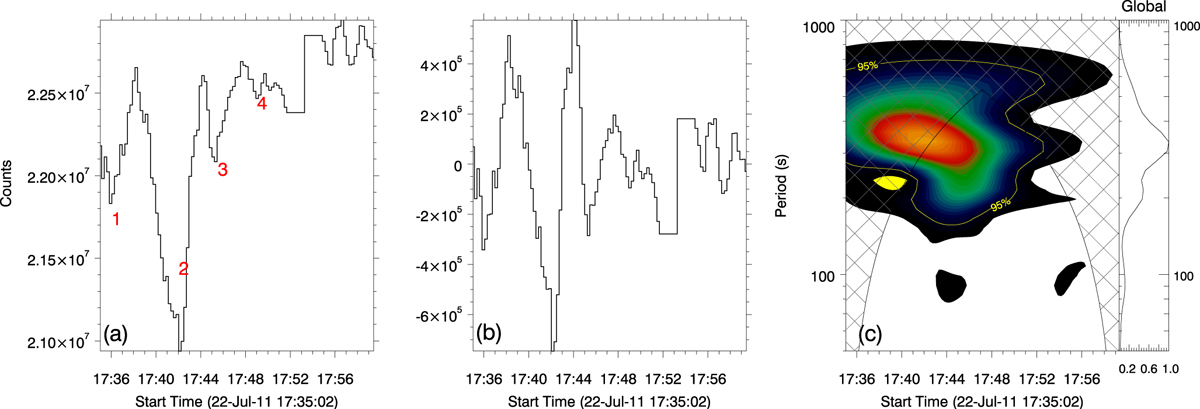
Periodicity of jet 2. Panel a: intensity variations in a selected region of the He I 10 830 Å image. Red numbers indicate the enhanced absorptions. Panel b: detrended light curve after subtracting the smoothed light curve from the original intensity. Panel c: wavelet power spectrum of the detrended signal and global wavelet power spectrum. Contour outlines the 95% significance level.
Current usage metrics show cumulative count of Article Views (full-text article views including HTML views, PDF and ePub downloads, according to the available data) and Abstracts Views on Vision4Press platform.
Data correspond to usage on the plateform after 2015. The current usage metrics is available 48-96 hours after online publication and is updated daily on week days.
Initial download of the metrics may take a while.