Fig. 7.
Download original image
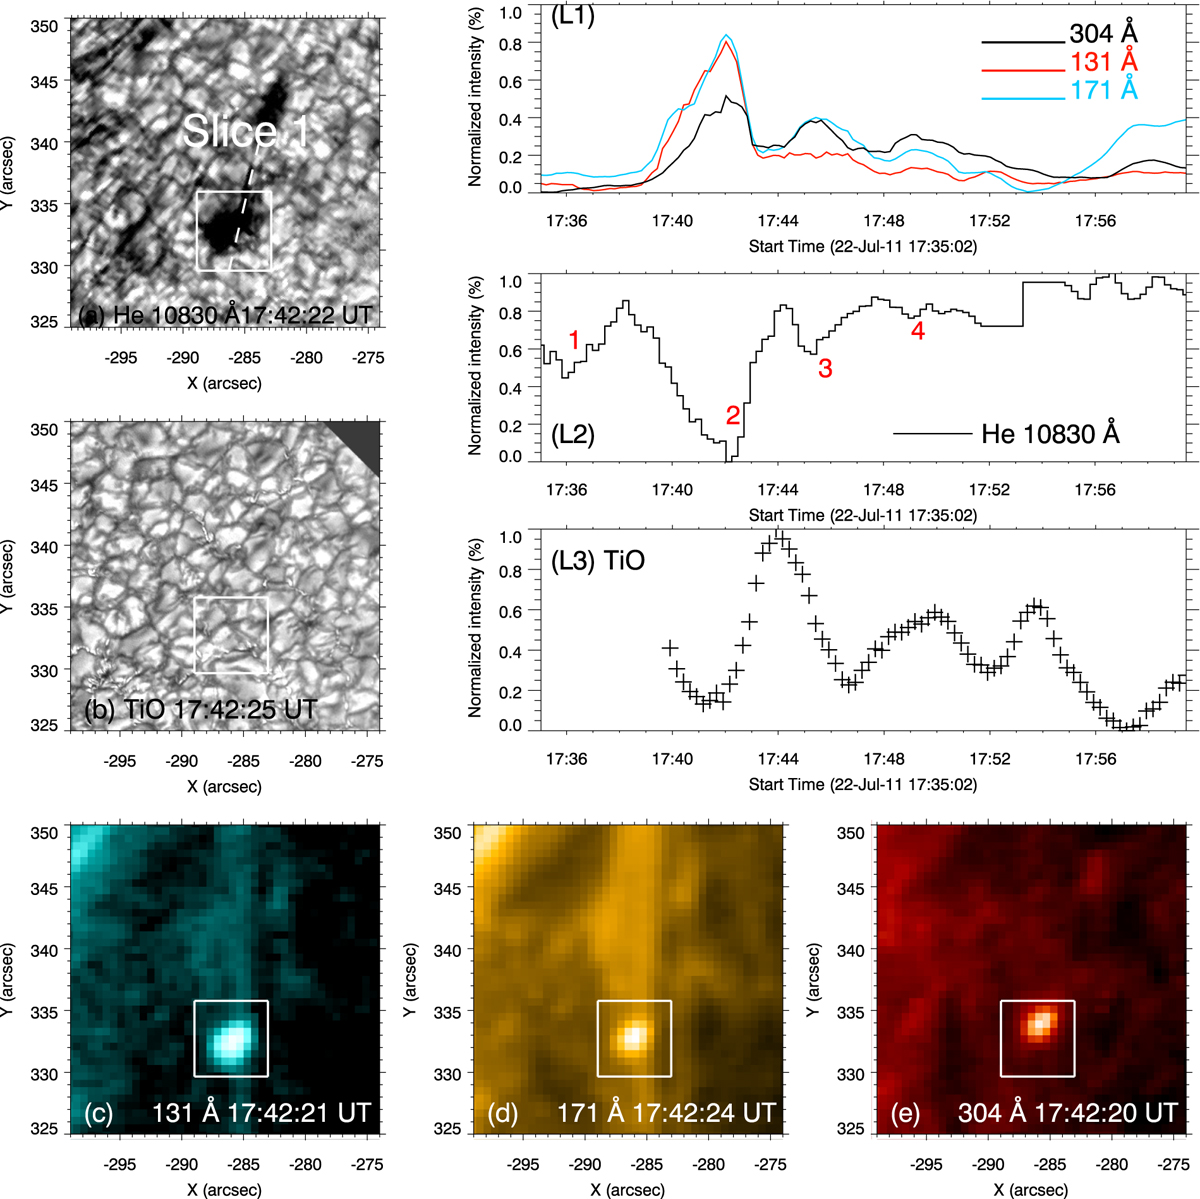
Morphology and time profiles for jet 2. Panels a–e give the morphology of jet 2 as observed in He I 10 830, TiO 7057, 131, 171, and 304 Å passbands. The time profiles for the integrated intensities of the jet in corresponding passbands are represented in panels L1, L2, and L3. The integrated region for the time profiles is the base of the jet inside the white boxes in panels a–e. An https://www.aanda.org/10.1051/0004-6361/202244607/olm animation of the figure is available; it lasts for 15 s from 17:35:00 UT to 17:55:56 UT.
Current usage metrics show cumulative count of Article Views (full-text article views including HTML views, PDF and ePub downloads, according to the available data) and Abstracts Views on Vision4Press platform.
Data correspond to usage on the plateform after 2015. The current usage metrics is available 48-96 hours after online publication and is updated daily on week days.
Initial download of the metrics may take a while.