Fig. 10.
Download original image
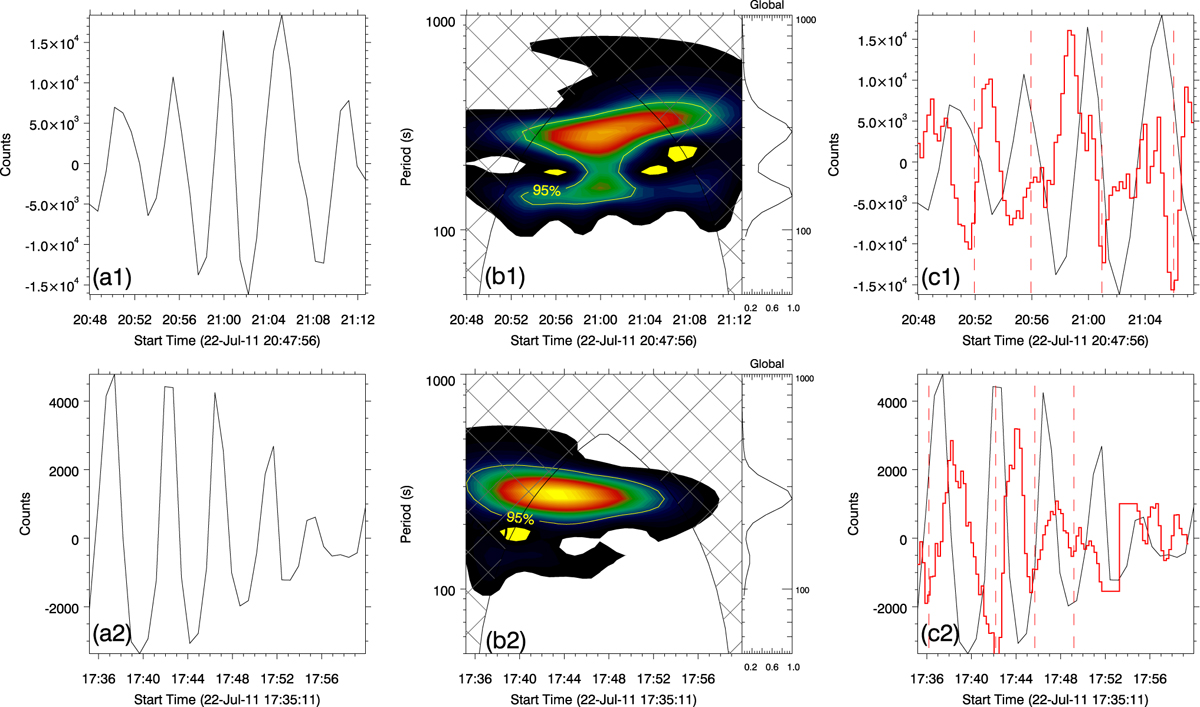
Periodicity of the doppler redshift velocity from SDO/HMI in the regions of jet 1 (upper panels) and jet 2 (lower panels). Left panels: detrended light curves after subtracting the smoothed light curves from the original light curves. Middle panels: wavelet power spectrum and global wavelet power spectrum of the detrended light curves from the doppler redshift velocity. Contour outlines the 95% significance level. Right panels: time profiles in left panels are superimposed with the detrended light curves of the two jets at He I 10 830 Å (red curves).
Current usage metrics show cumulative count of Article Views (full-text article views including HTML views, PDF and ePub downloads, according to the available data) and Abstracts Views on Vision4Press platform.
Data correspond to usage on the plateform after 2015. The current usage metrics is available 48-96 hours after online publication and is updated daily on week days.
Initial download of the metrics may take a while.