Fig. 8
Download original image
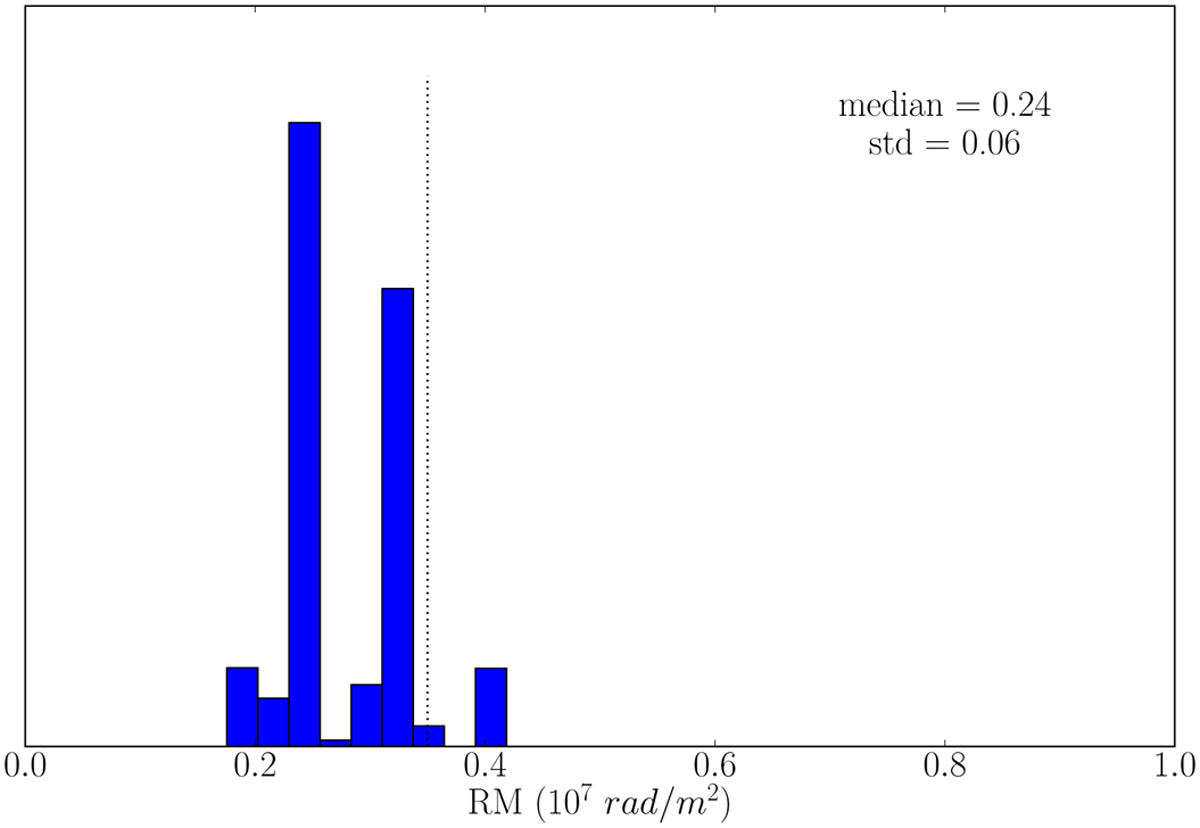
Results of the MCMC posterior sampling of the model consisting of three polarized components, fitting two of them (the core and knot B of the simulated M87-like source), for the simulated data. The histogram shows the RM of the core, and the dotted line indicates the (higher) expected value, (0.35 ± 0.04) × 107 rad m−2, increased in our simulation, from the image analysis.
Current usage metrics show cumulative count of Article Views (full-text article views including HTML views, PDF and ePub downloads, according to the available data) and Abstracts Views on Vision4Press platform.
Data correspond to usage on the plateform after 2015. The current usage metrics is available 48-96 hours after online publication and is updated daily on week days.
Initial download of the metrics may take a while.