Fig. 5
Download original image
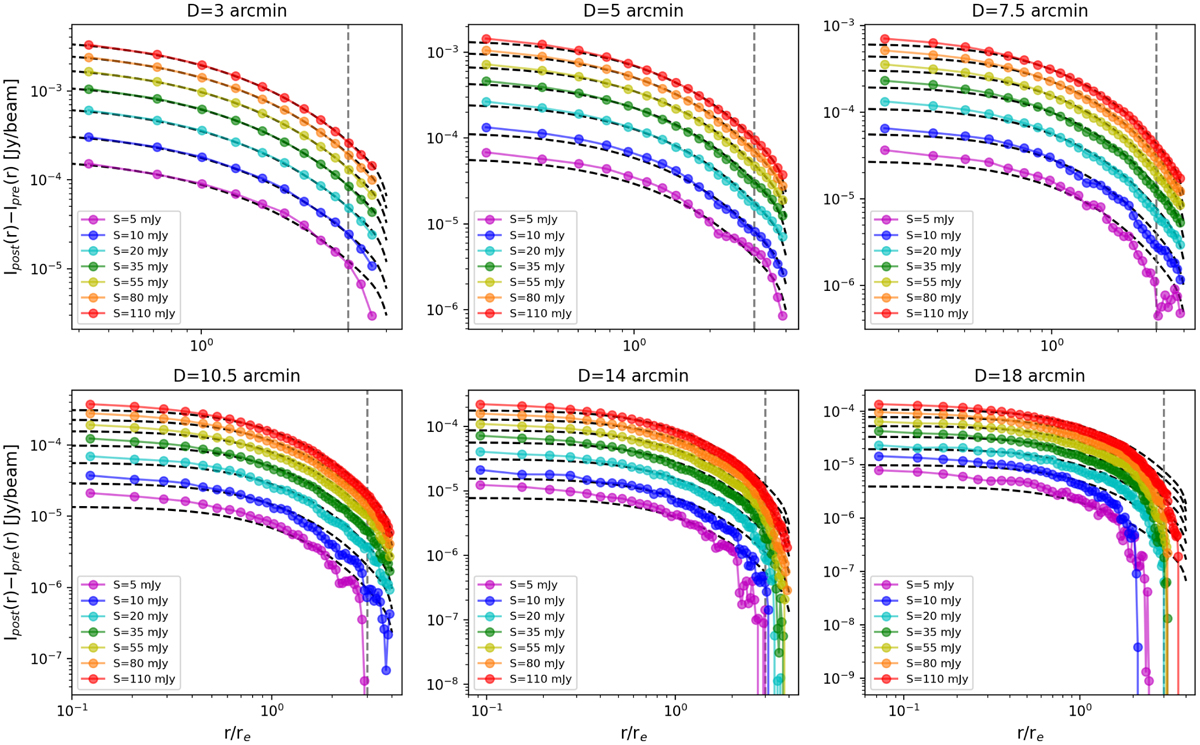
Net azimuthally averaged surface brightness profiles of the images shown in Appendix A for PSZ2 G098.62+51.76. The dashed black lines represent the theoretical injected profiles. The sampled profiles (Sinj, tot is reported in the legend) are obtained by subtracting the pre-injection from the post-injection contribution. The grey vertical line indicates r = 3re.
Current usage metrics show cumulative count of Article Views (full-text article views including HTML views, PDF and ePub downloads, according to the available data) and Abstracts Views on Vision4Press platform.
Data correspond to usage on the plateform after 2015. The current usage metrics is available 48-96 hours after online publication and is updated daily on week days.
Initial download of the metrics may take a while.