Fig. 4
Download original image
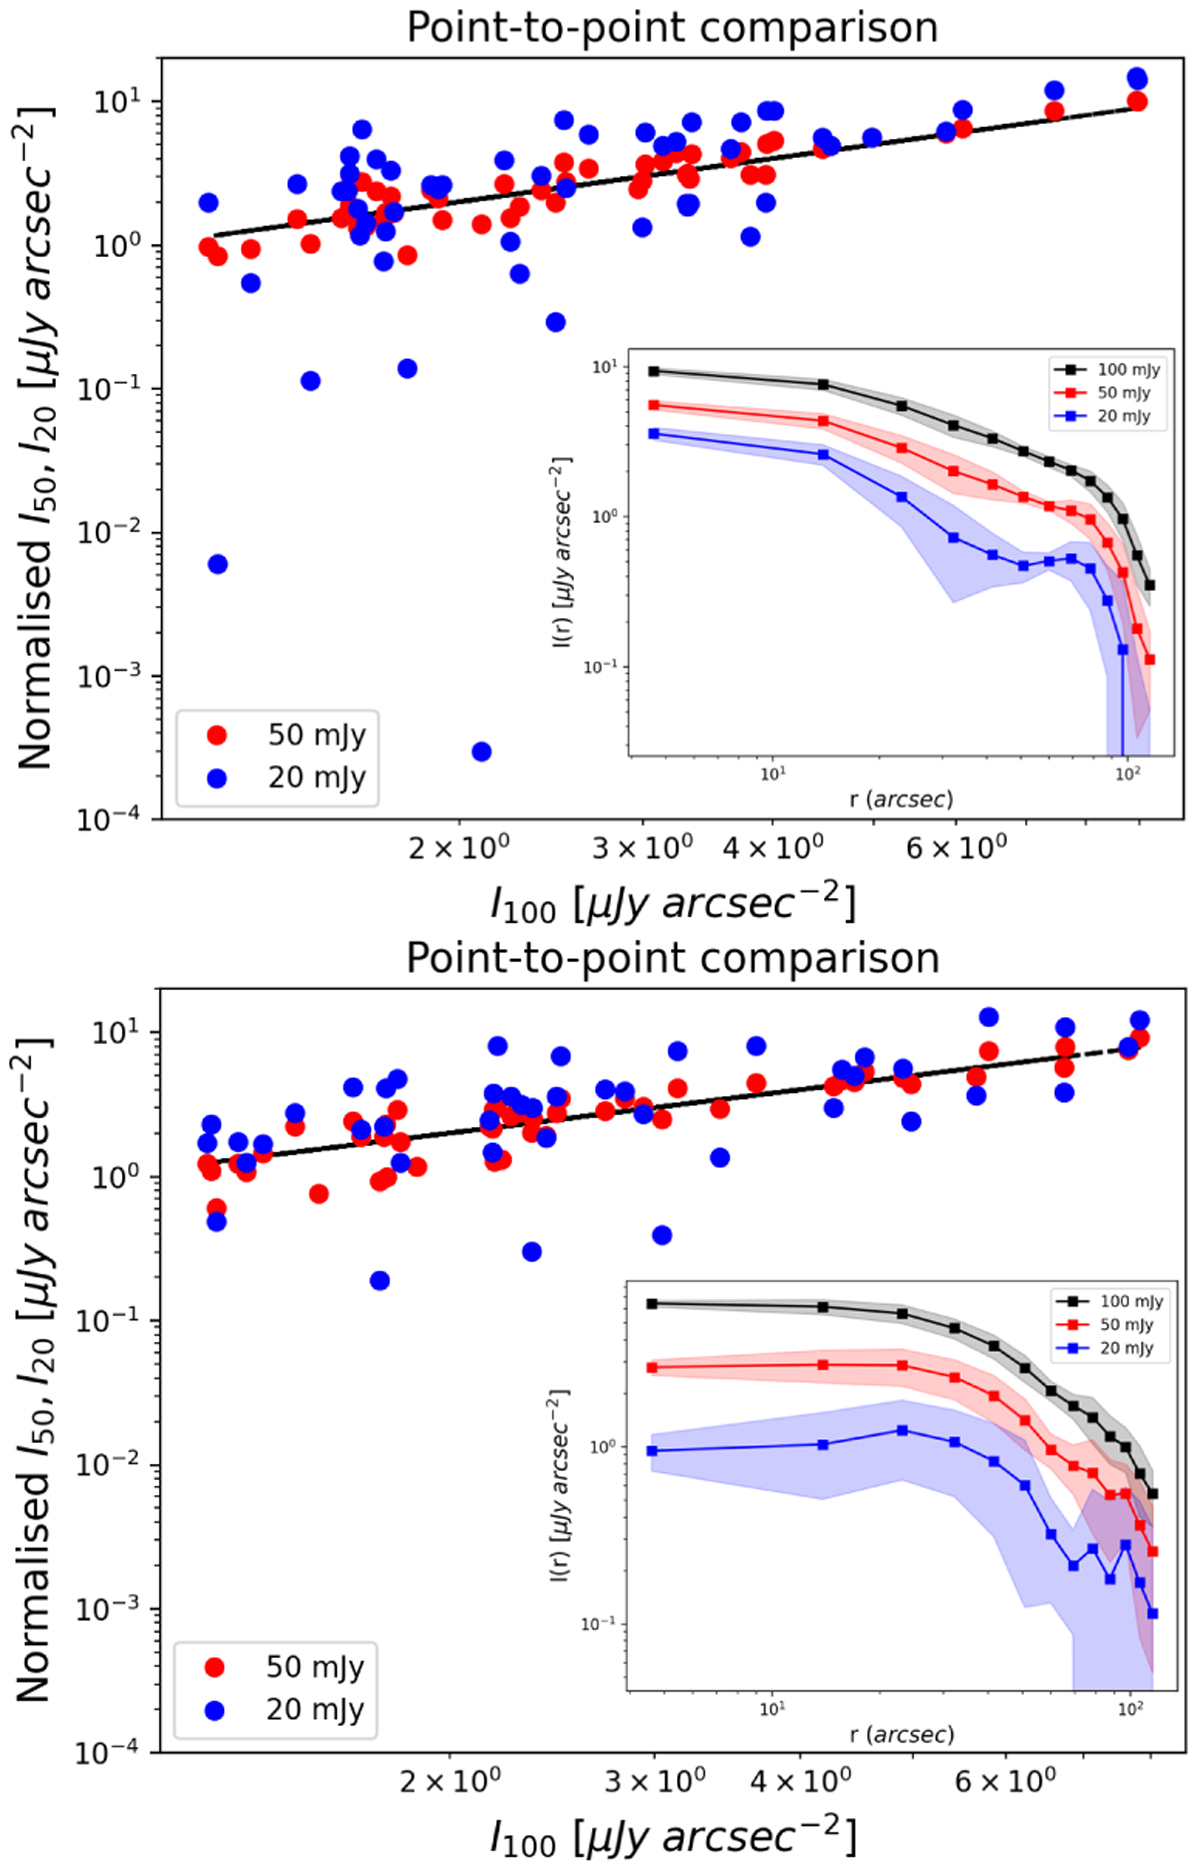
Point-to-point comparison of surface brightness of mock halos in PSZ2 G120.08-44.41 (‘Sub. & Inj.’ scheme; central and peripheral injections are shown in the upper and lower panel, respectively). Values at 20 and 50 mJy are multiplied by a factor of 5 and 2, respectively, to match the injection at 100 mJy. The one-to-one line is plotted in black. Insets show the corresponding radial profiles, whose points are obtained as the average brightness of four 90°-wide sectors, whereas the shaded region represents their standard deviation. The point-to-point plots show that the lower the brightness and the injected flux density, the higher the scatter around the one-to-one line, indicating the progressive apparition of emission patches. Analogously, the radial profiles indicate that the scatter increases at larger radii and lower brightness.
Current usage metrics show cumulative count of Article Views (full-text article views including HTML views, PDF and ePub downloads, according to the available data) and Abstracts Views on Vision4Press platform.
Data correspond to usage on the plateform after 2015. The current usage metrics is available 48-96 hours after online publication and is updated daily on week days.
Initial download of the metrics may take a while.