Fig. 3
Download original image
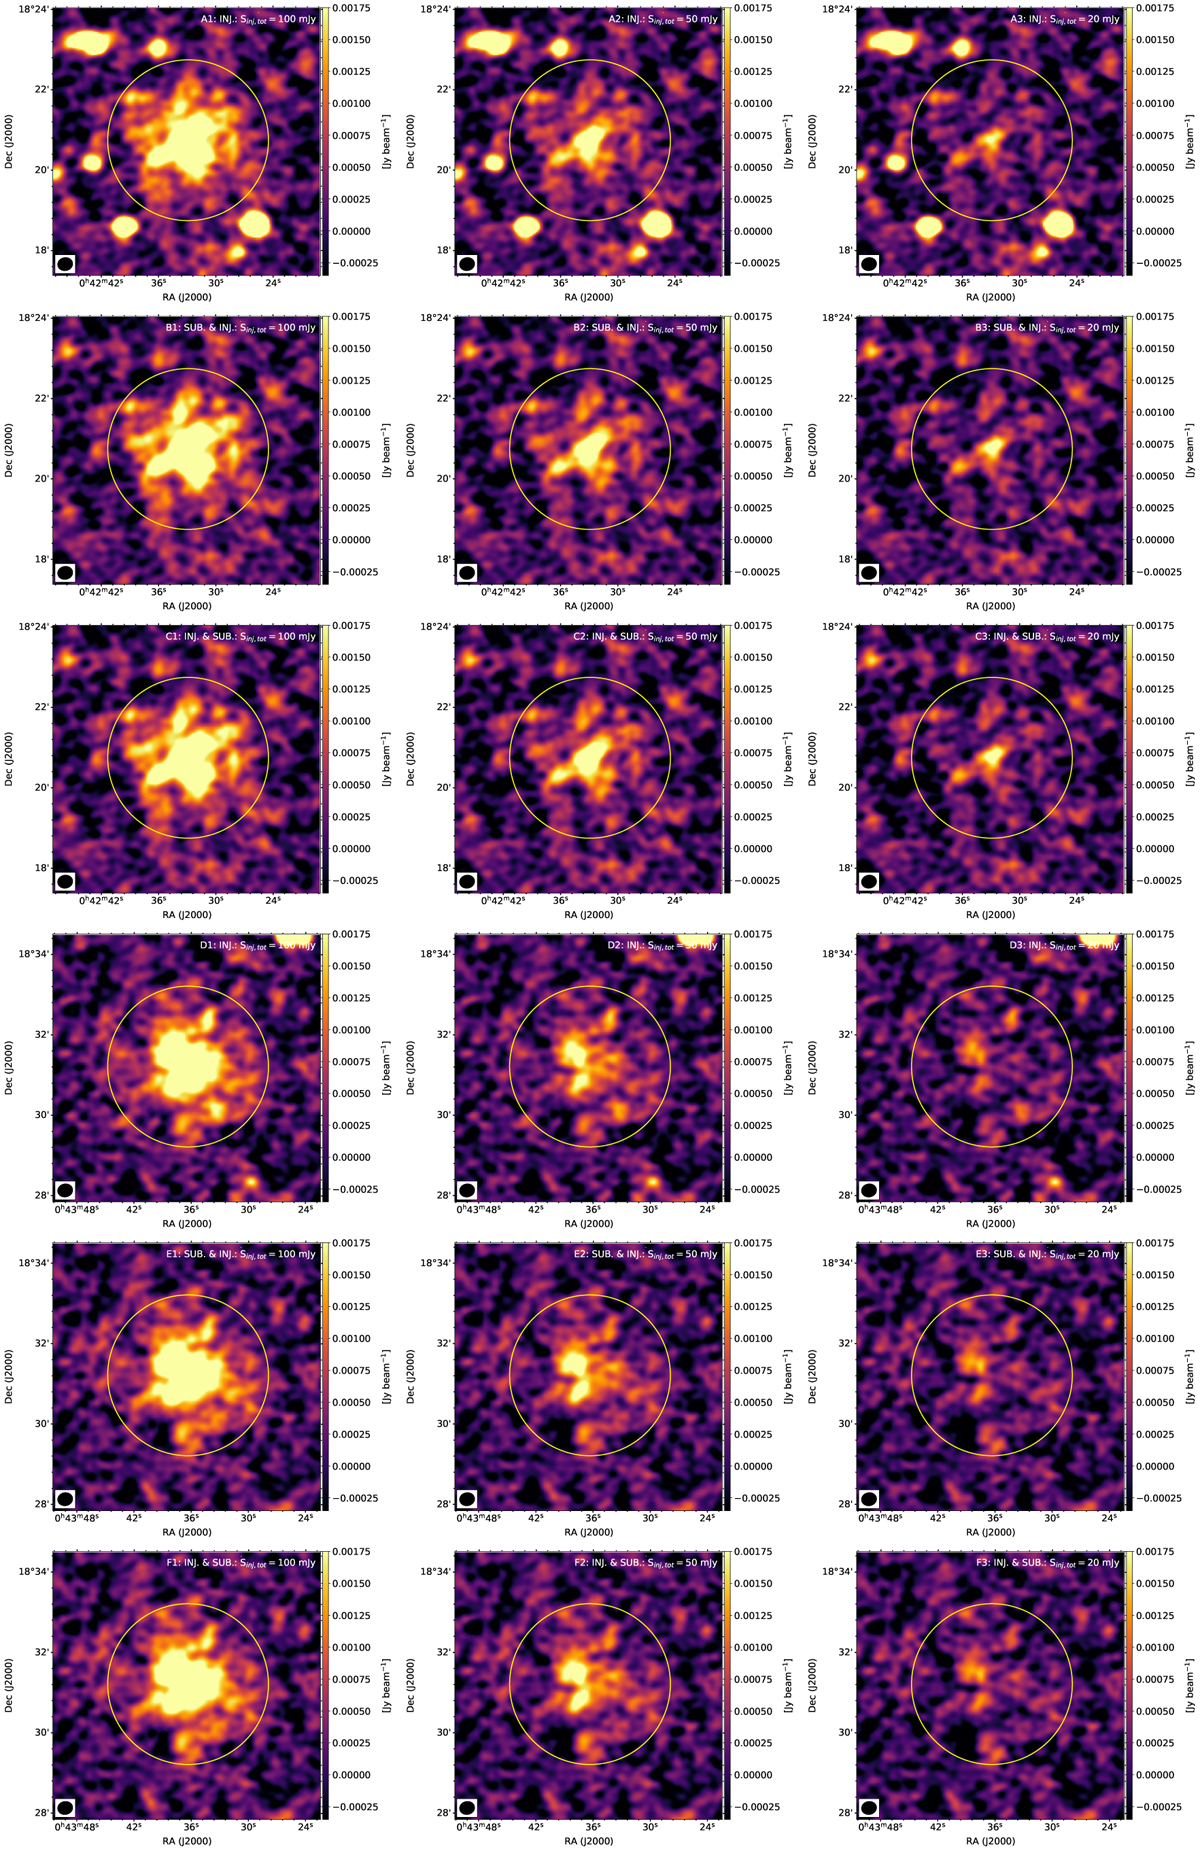
Restored images after injections in centre (panels A–C) and periphery (panels D–F) of PSZ2 G120.08-44.41 with different schemes: injection in the original dataset (‘INJ.’, panels A and D), injection in the discrete source-subtracted dataset (‘SUB. & INJ.’, panels B and E), and injection in the original dataset and subsequent subtraction of the discrete sources (‘INJ. & SUB.’, panels C and F). The yellow circle (centred on RAinj, Decinj) has a radius of 3re and contains Sinj = 0.8Sinj,tot, where Sinj,tot = 100, 50, and 20 mJy, for panels in Cols. 1–3, respectively.
Current usage metrics show cumulative count of Article Views (full-text article views including HTML views, PDF and ePub downloads, according to the available data) and Abstracts Views on Vision4Press platform.
Data correspond to usage on the plateform after 2015. The current usage metrics is available 48-96 hours after online publication and is updated daily on week days.
Initial download of the metrics may take a while.