Fig. 14
Download original image
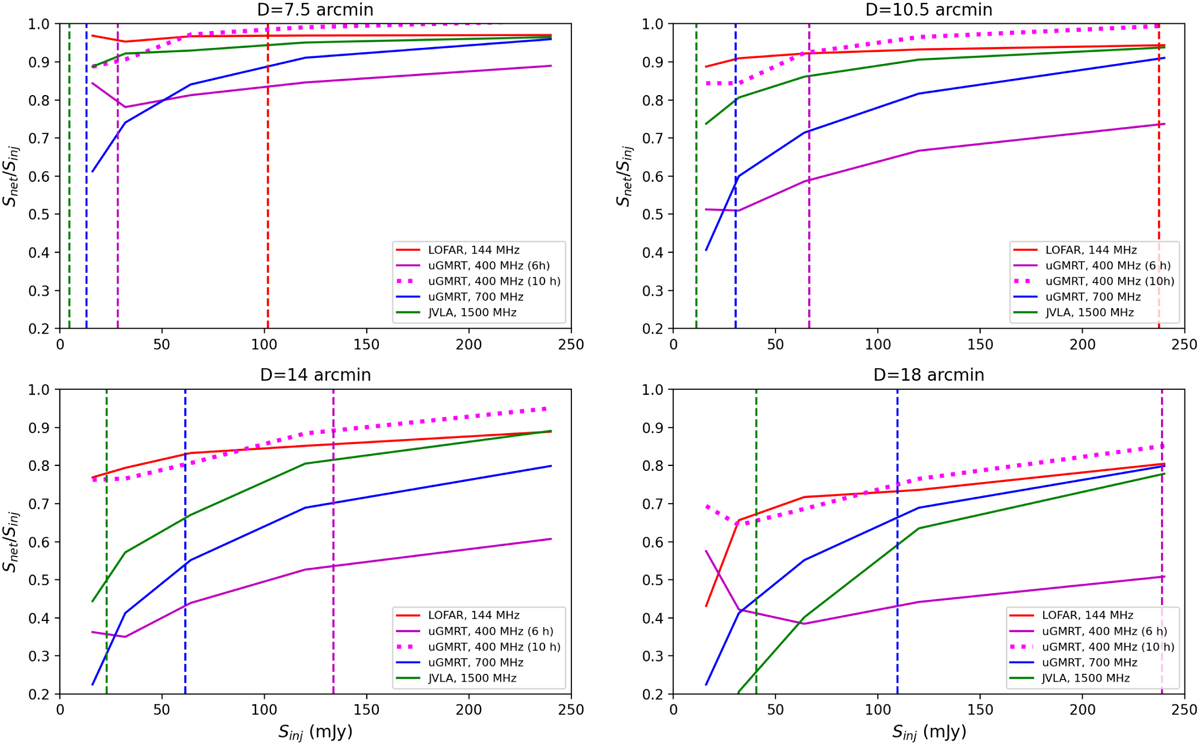
Recovered net flux density as a function of the injected flux density for various angular diameters and instruments. Red, magenta, blue, and green curves are injections in LOFAR (HBA at 144 MHz), uGMRT (band 3 at 400 MHz, 6 and 10 h on source are shown with solid and dotted lines, respectively), uGMRT (band 4 at 700 MHz), and JVLA (DnC+BnC array, L band at 1.5 GHz) datasets, respectively. The expected flux density integrated up to 3re of a representative radio halo with M500 = 5 × 10¹⁴ M⊙ is indicated by a dashed vertical line and can be exploited to estimate effective losses (see Table 3 and discussion in Sect. 6).
Current usage metrics show cumulative count of Article Views (full-text article views including HTML views, PDF and ePub downloads, according to the available data) and Abstracts Views on Vision4Press platform.
Data correspond to usage on the plateform after 2015. The current usage metrics is available 48-96 hours after online publication and is updated daily on week days.
Initial download of the metrics may take a while.