Fig. 10
Download original image
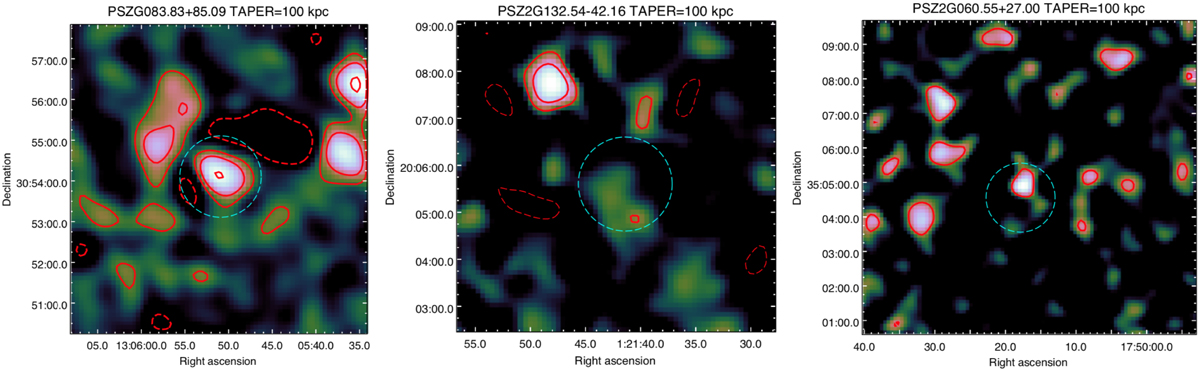
Representative examples of NDE clusters showing artefacts introduced by the subtraction of discrete sources near the cluster centre. The radio contours are drawn at ±2σ and spaced by factors of 2. In all the panels, the dashed cyan circle indicates the cluster centre and has a fixed diameter of 2′. Left: NDE cluster excluded from our analysis due to severe (positive and/or negative) artefacts. Middle: NDE cluster with SQ = 1 due to the absence of artefacts. Right: NDE cluster with SQ = 2 due to the presence of moderate residuals.
Current usage metrics show cumulative count of Article Views (full-text article views including HTML views, PDF and ePub downloads, according to the available data) and Abstracts Views on Vision4Press platform.
Data correspond to usage on the plateform after 2015. The current usage metrics is available 48-96 hours after online publication and is updated daily on week days.
Initial download of the metrics may take a while.