Fig. 5
Download original image
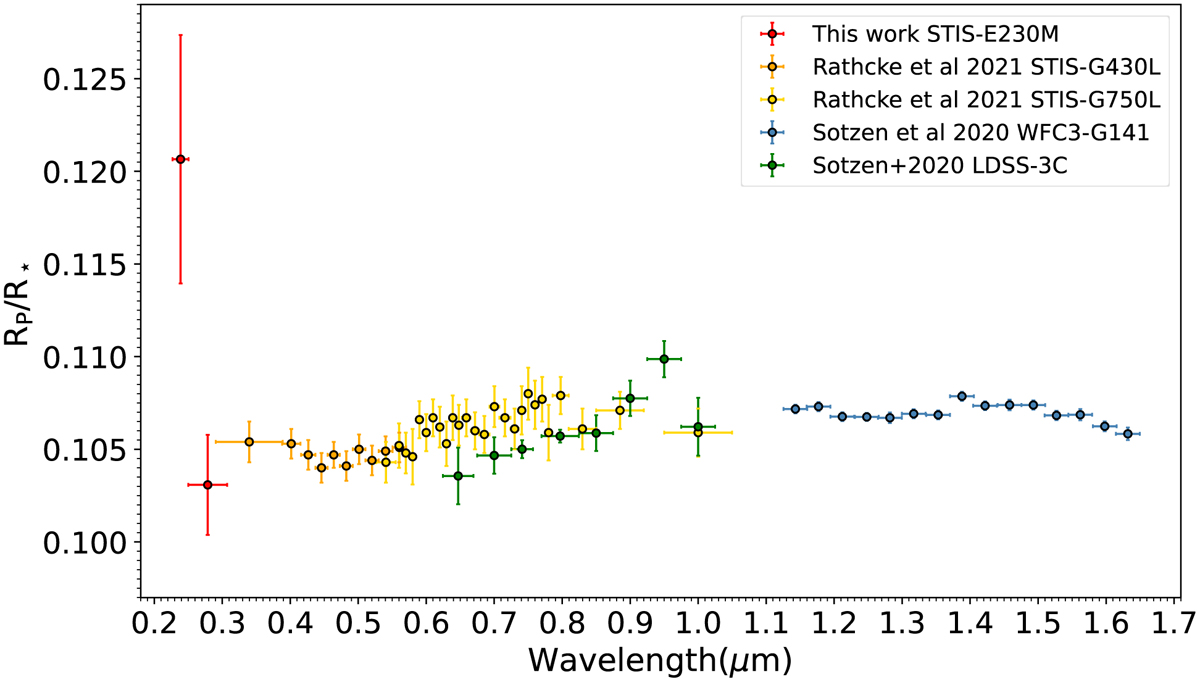
WASP-79b HST transmission spectrum. NUV values are from the broadband analysis of visit #66 obtained here using the STIS E23OM observations (in red). For clarity, we represent two values around 2400 Å and 2700 Å (Bins 1 and 2 in Table 6). The optical values are from the analysis of Rathcke et al. (2021) of STIS G43OL and G75OL data (orange and yellow). HST WFC3 observations in the NIR are from Sotzen et al. (2020, blue).
Current usage metrics show cumulative count of Article Views (full-text article views including HTML views, PDF and ePub downloads, according to the available data) and Abstracts Views on Vision4Press platform.
Data correspond to usage on the plateform after 2015. The current usage metrics is available 48-96 hours after online publication and is updated daily on week days.
Initial download of the metrics may take a while.