Open Access
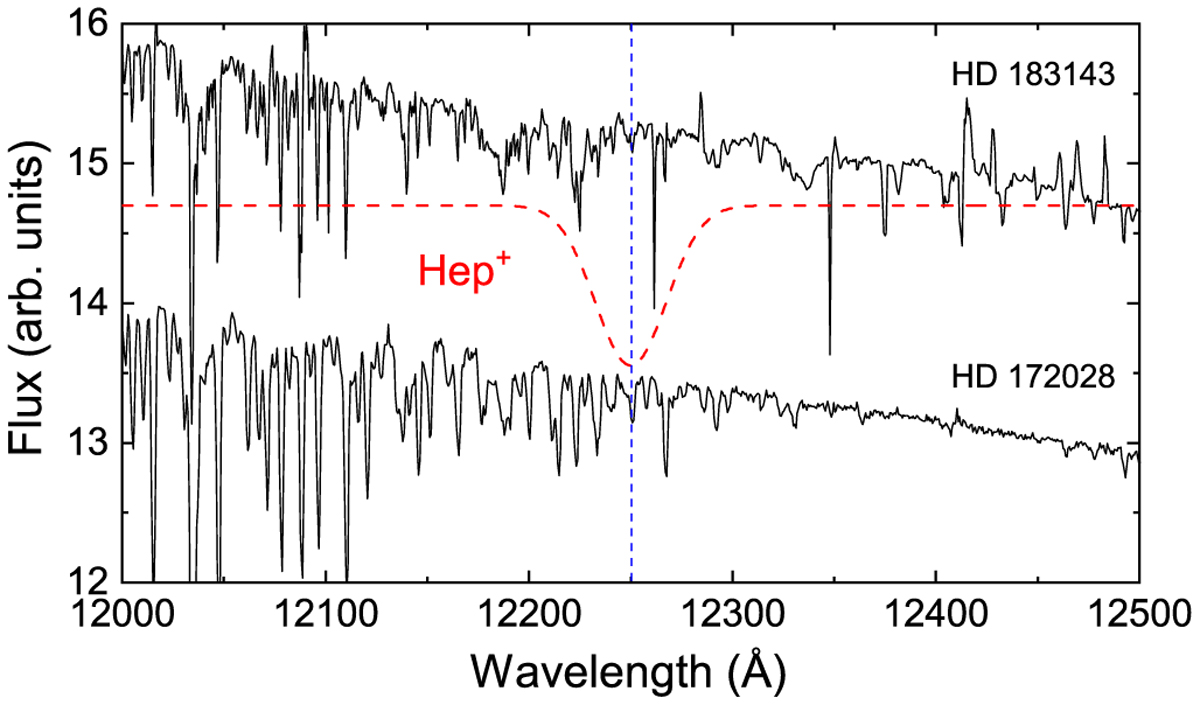
Fig. 4
Download original image
Comparison of observational spectra along the lines of sight HD 183143 and HD 172028 with the most intense 2Au(0) ← 2B2g(0) band of Hep+ with the parameters evaluated for the gas phase. The vertical dashed line marks the position of the peak maximum of this band.
Current usage metrics show cumulative count of Article Views (full-text article views including HTML views, PDF and ePub downloads, according to the available data) and Abstracts Views on Vision4Press platform.
Data correspond to usage on the plateform after 2015. The current usage metrics is available 48-96 hours after online publication and is updated daily on week days.
Initial download of the metrics may take a while.