Fig. 1
Download original image
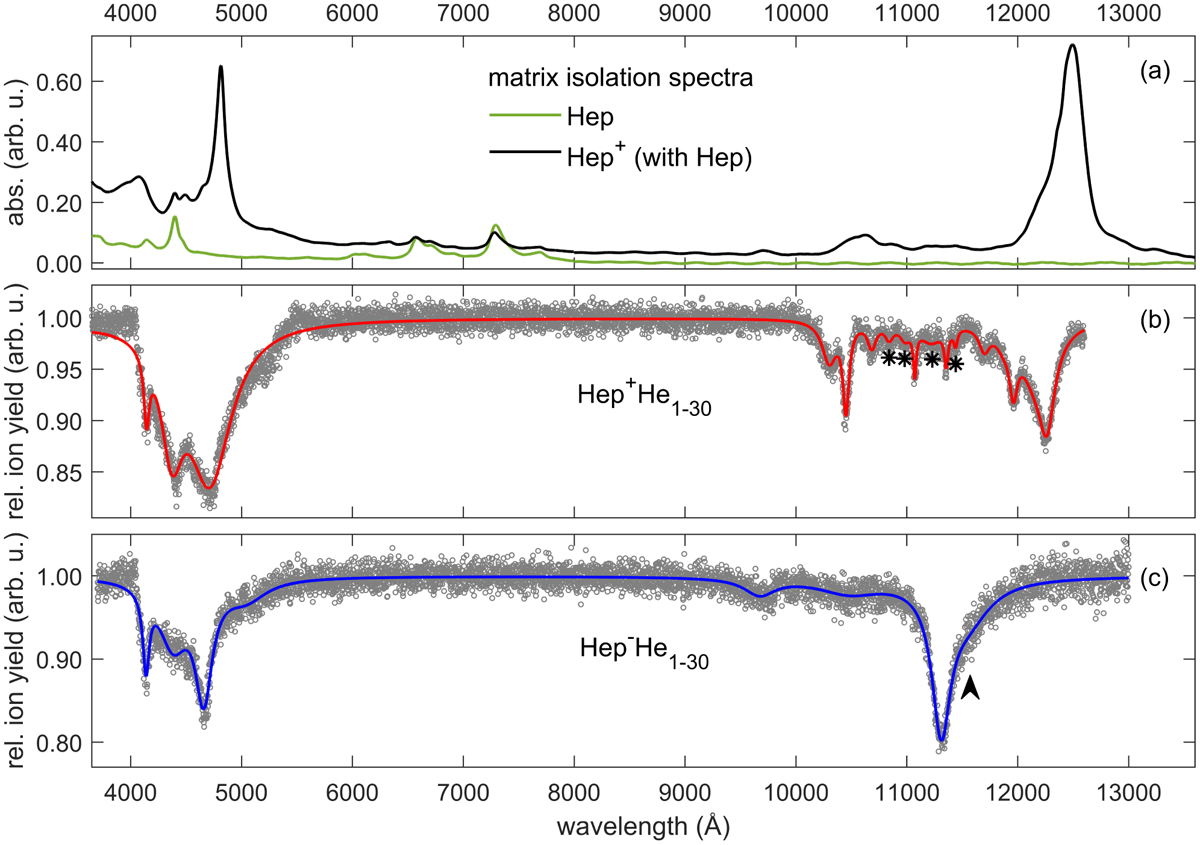
Laboratory spectra of Hep+/0/−. (a) Absorption spectra of Hep and Hep+ isolated in an Ar matrix at 15 K. The weak sinusoidal oscillation in the NIR range is not a real absorption and is associated with an interference. The Hep+ spectrum was recorded after irradiation of matrix-isolated Hep with 185 nm photons for 30 min. (b) Photodissociation spectrum of Hep+ obtained by monitoring the ion signals on the masses of Hep+He1−30 as a function of the laser wavelength. (c) Photodissociation spectrum of Hep− obtained by monitoring the ion signals on the masses of Hep−He1−30 as a function of the laser wavelength. The parameters of peaks marked with asterisks in panel (b) and the shoulder marked by an arrow in panel (c) cannot be reliably defined.
Current usage metrics show cumulative count of Article Views (full-text article views including HTML views, PDF and ePub downloads, according to the available data) and Abstracts Views on Vision4Press platform.
Data correspond to usage on the plateform after 2015. The current usage metrics is available 48-96 hours after online publication and is updated daily on week days.
Initial download of the metrics may take a while.