Fig. 8.
Download original image
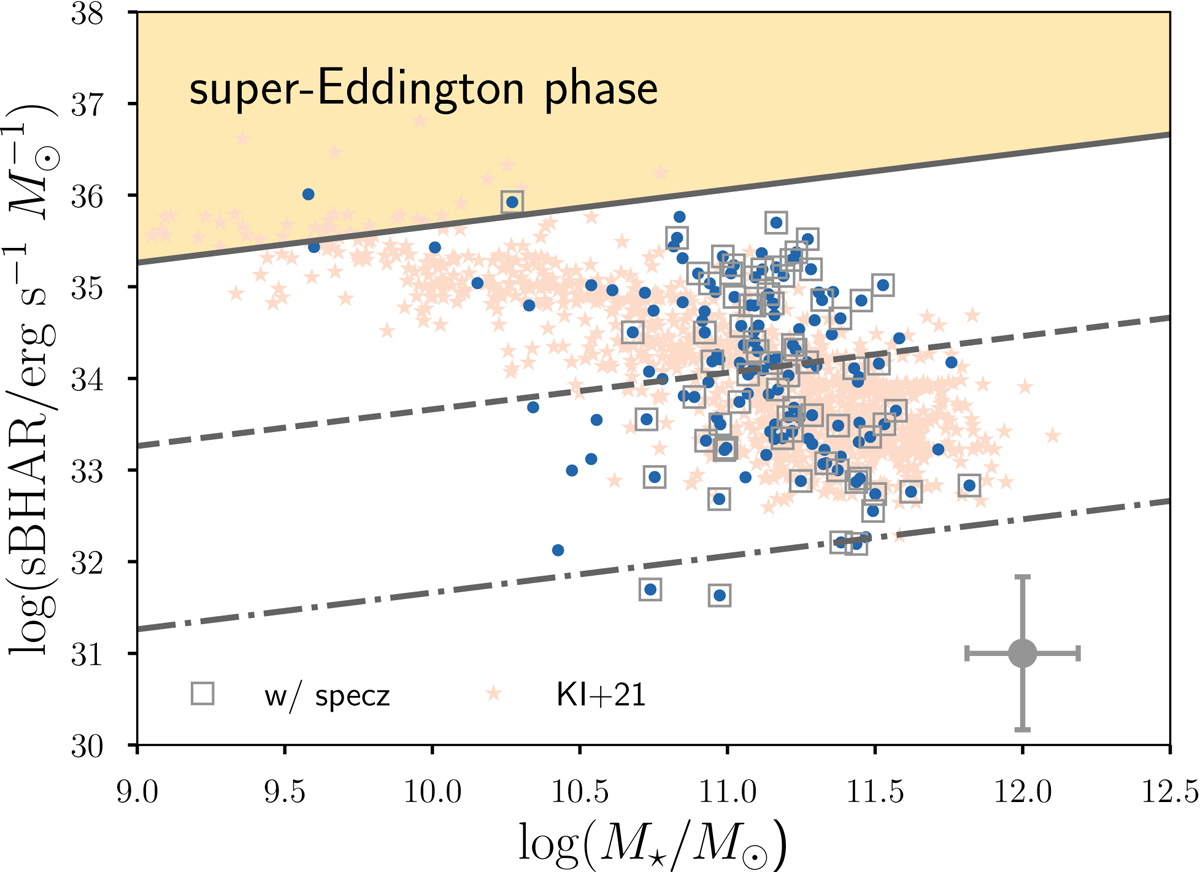
Relation between sBHAR (=LAGN,bol/M⋆ erg s![]() ) and M⋆. The gray cross represents the typical error bar of the two values. The orange shaded area represents the region of super-Eddington λEdd > 1. The three straight lines (from top to bottom) are the expected Eddington ratio of λEdd = 1 (Eddington limit; black solid line), λEdd = 0.01 (black dashed line), and λEdd = 10−4 (black dot-dashed line) using Eq. (7). The pale pink stars in the background represent the sources from the original WERGS sample with IR detections (KI+21; Ichikawa et al. 2021). The other symbols are the same as in Fig. 1.
) and M⋆. The gray cross represents the typical error bar of the two values. The orange shaded area represents the region of super-Eddington λEdd > 1. The three straight lines (from top to bottom) are the expected Eddington ratio of λEdd = 1 (Eddington limit; black solid line), λEdd = 0.01 (black dashed line), and λEdd = 10−4 (black dot-dashed line) using Eq. (7). The pale pink stars in the background represent the sources from the original WERGS sample with IR detections (KI+21; Ichikawa et al. 2021). The other symbols are the same as in Fig. 1.
Current usage metrics show cumulative count of Article Views (full-text article views including HTML views, PDF and ePub downloads, according to the available data) and Abstracts Views on Vision4Press platform.
Data correspond to usage on the plateform after 2015. The current usage metrics is available 48-96 hours after online publication and is updated daily on week days.
Initial download of the metrics may take a while.