Fig. 3.
Download original image
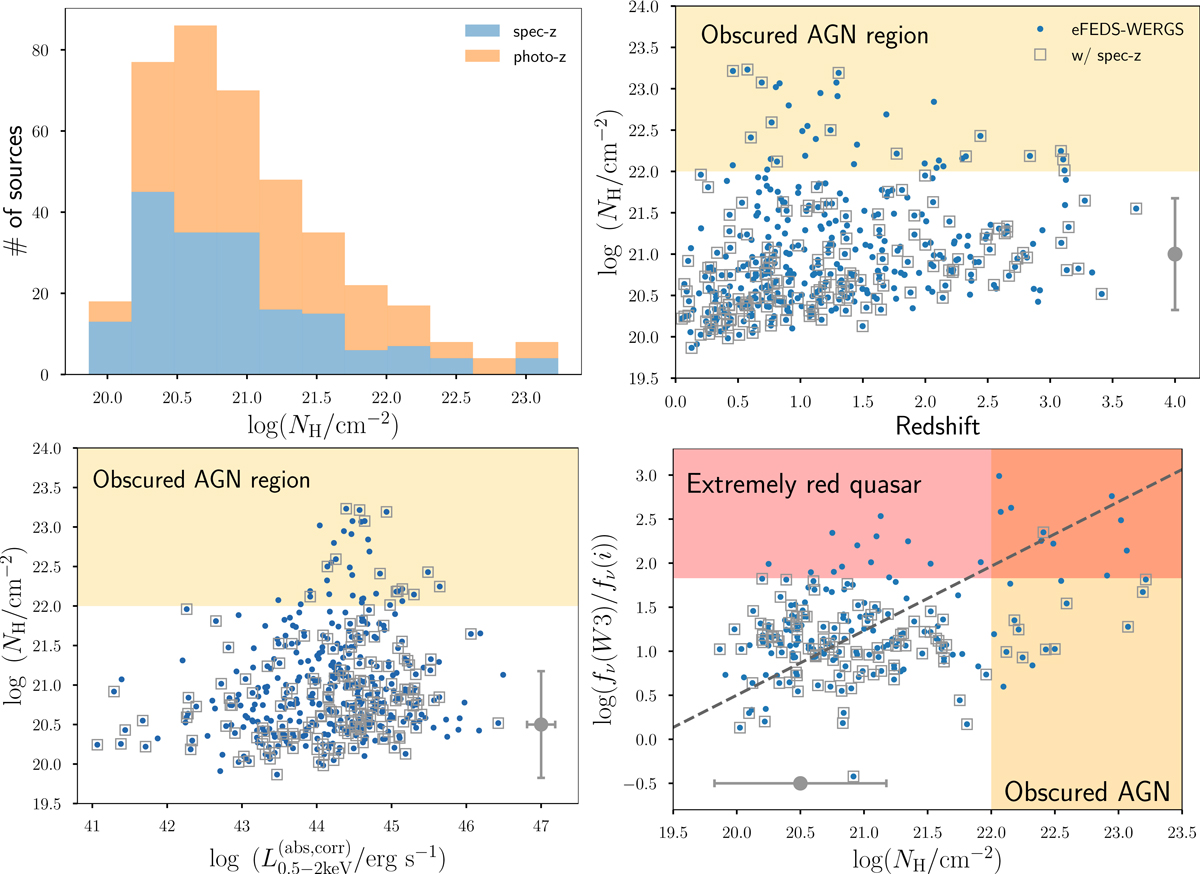
Obscuration properties of the eFEDS-WERGS sample. Top left: histogram of log(NH/cm−2). The sources are divided into two subgroups with spec-z (cyan) and phot-z (orange). Top right: log NH as a function of redshift. The gray error bar shows a typical logarithmic error of log NH. Bottom left: log NH as a function of 0.5−2 KeV X-ray luminosity (![]() ). The orange shaded area represents the region of obscured AGN with log(NH/cm−2) > 22. The symbols are same as in Fig. 1, and the gray error bar shows a typical logarithmic error of log NH and log
). The orange shaded area represents the region of obscured AGN with log(NH/cm−2) > 22. The symbols are same as in Fig. 1, and the gray error bar shows a typical logarithmic error of log NH and log![]() . Bottom right: relation between the flux density ratio of 12 μm to optical iAB band and the log (NH/cm−2). The dashed black line represents the slope of the fitting. The red shaded area represents the region of extremely red quasars which fulfill fν(12 μm)/fν, i-band > 101.84 (Hamann et al. 2017). The orange shaded area represents the obscured AGN region. The other symbols are the same as in Fig. 1.
. Bottom right: relation between the flux density ratio of 12 μm to optical iAB band and the log (NH/cm−2). The dashed black line represents the slope of the fitting. The red shaded area represents the region of extremely red quasars which fulfill fν(12 μm)/fν, i-band > 101.84 (Hamann et al. 2017). The orange shaded area represents the obscured AGN region. The other symbols are the same as in Fig. 1.
Current usage metrics show cumulative count of Article Views (full-text article views including HTML views, PDF and ePub downloads, according to the available data) and Abstracts Views on Vision4Press platform.
Data correspond to usage on the plateform after 2015. The current usage metrics is available 48-96 hours after online publication and is updated daily on week days.
Initial download of the metrics may take a while.