Fig. 11.
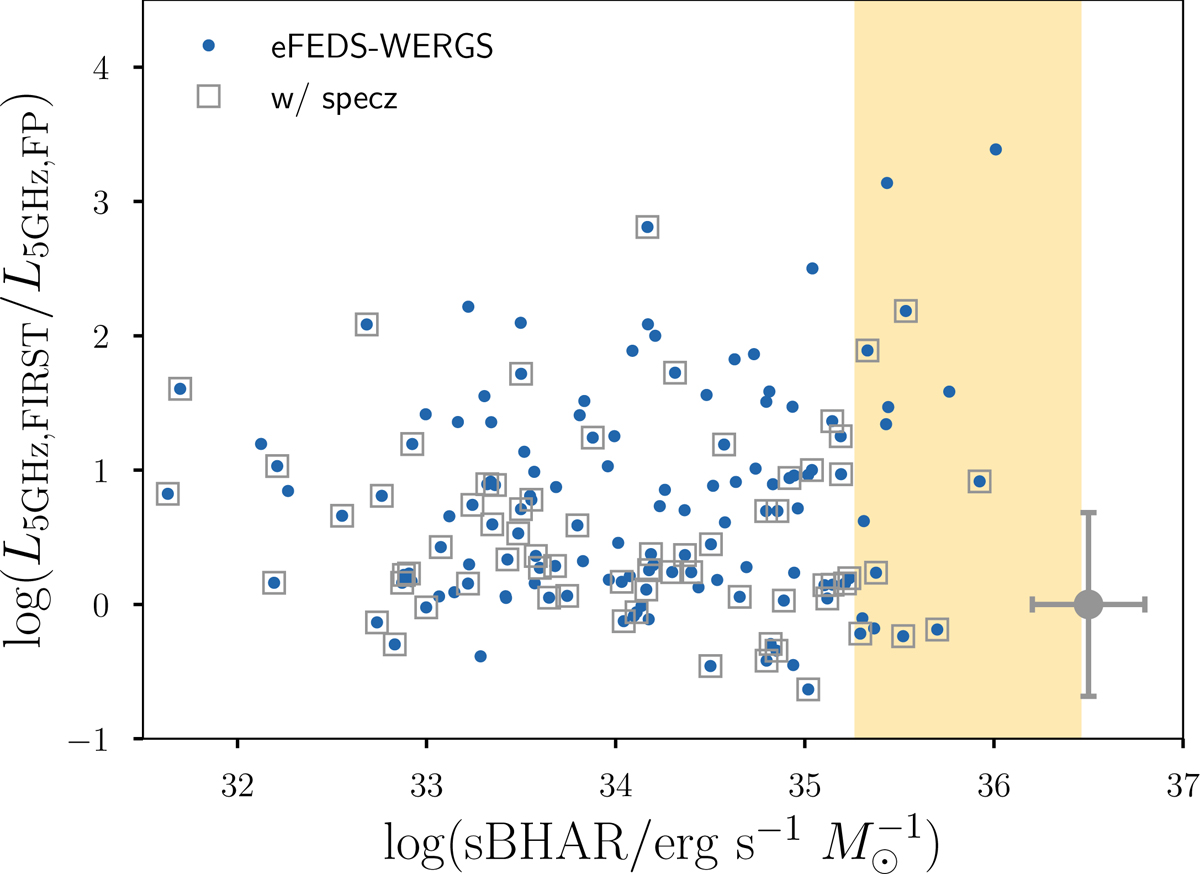
Download original image
Radio-luminosity ratio of L5 GHz, FIRST/L5 GHz, FP as a function of sBHAR. The yellow shaded area represents the corresponding Eddington limit accretion (λEdd = 1) region assuming the local scaling relation of MBH − M⋆ (Kormendy & Ho 2013) for the range of 9 < log(M⋆/M⊙) < 12 where our sources reside, as shown in Fig. 8. The gray cross represents the typical error bar of the two values.
Current usage metrics show cumulative count of Article Views (full-text article views including HTML views, PDF and ePub downloads, according to the available data) and Abstracts Views on Vision4Press platform.
Data correspond to usage on the plateform after 2015. The current usage metrics is available 48-96 hours after online publication and is updated daily on week days.
Initial download of the metrics may take a while.