Fig. 8
Download original image
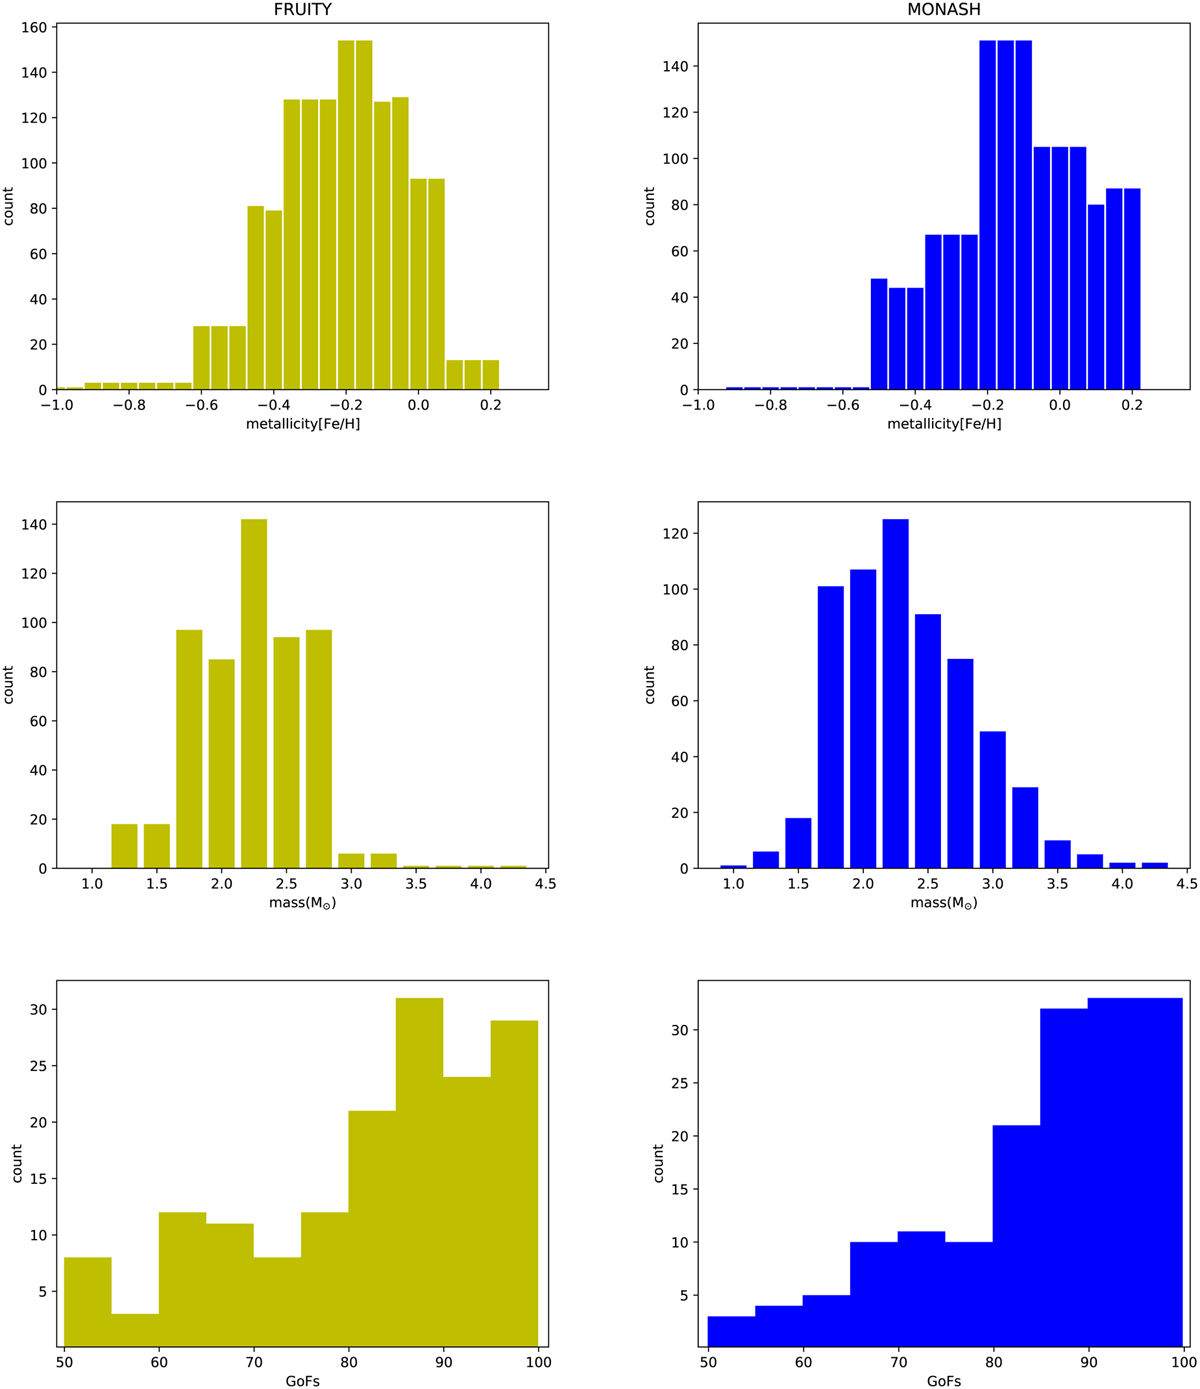
Distributions of final classifications for both sets of AGB final surface abundances. From top to bottom we show the distributions for the (1) metallicities, (2) masses, and (3) minimum GoFs of the classifications as listed in the tables in Appendix A. The left column shows the distribution for FRUITY and the right column shows those for Monash.
Current usage metrics show cumulative count of Article Views (full-text article views including HTML views, PDF and ePub downloads, according to the available data) and Abstracts Views on Vision4Press platform.
Data correspond to usage on the plateform after 2015. The current usage metrics is available 48-96 hours after online publication and is updated daily on week days.
Initial download of the metrics may take a while.