Fig. 1
Download original image
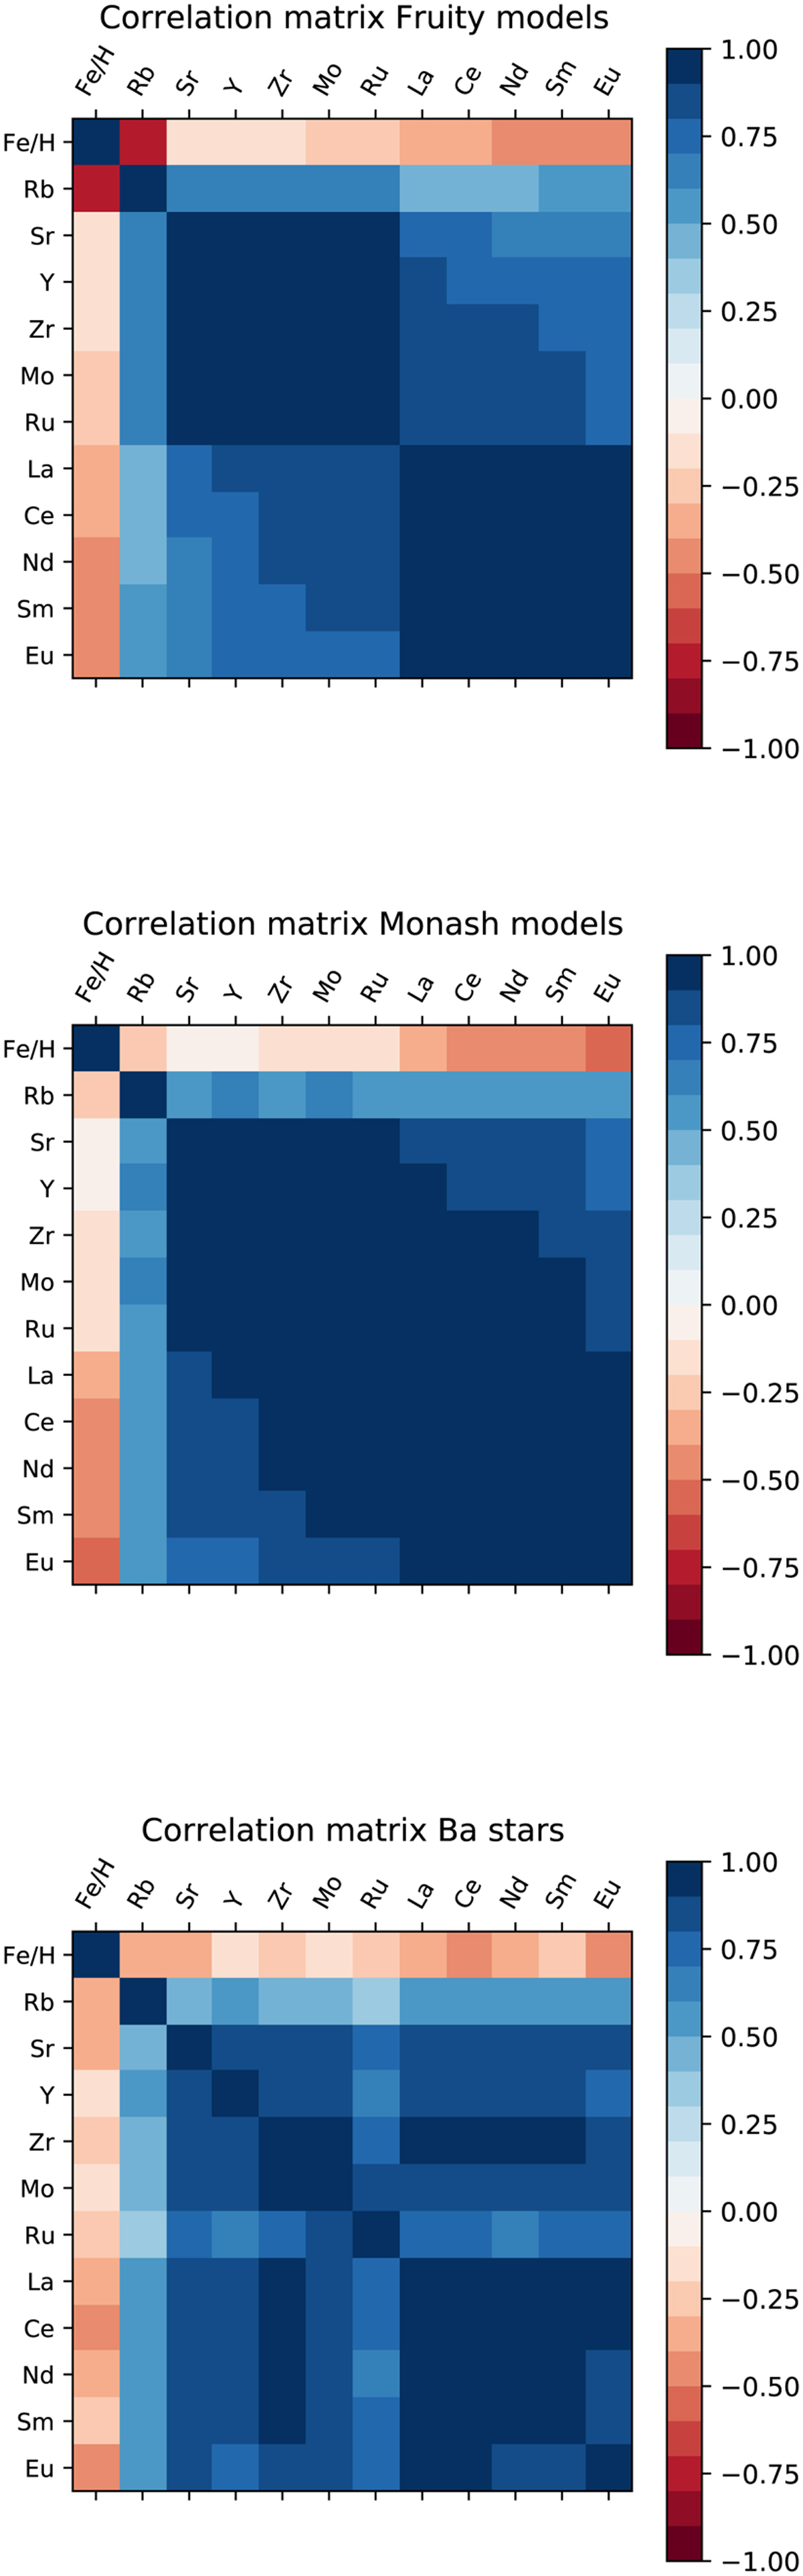
Correlation matrix demonstrating linear relationship between pairs of elements in AGB final surface abundances of FRUITY (top panel), Monash (middle panel), and observed Ba star sample (bottom panel, excluding the error bars on the observations). The stronger the correlation, the darker the color of the boxes. Blue shaded boxes: positive correlation. Red shaded boxes: negative correlation).
Current usage metrics show cumulative count of Article Views (full-text article views including HTML views, PDF and ePub downloads, according to the available data) and Abstracts Views on Vision4Press platform.
Data correspond to usage on the plateform after 2015. The current usage metrics is available 48-96 hours after online publication and is updated daily on week days.
Initial download of the metrics may take a while.