Fig. 9
Download original image
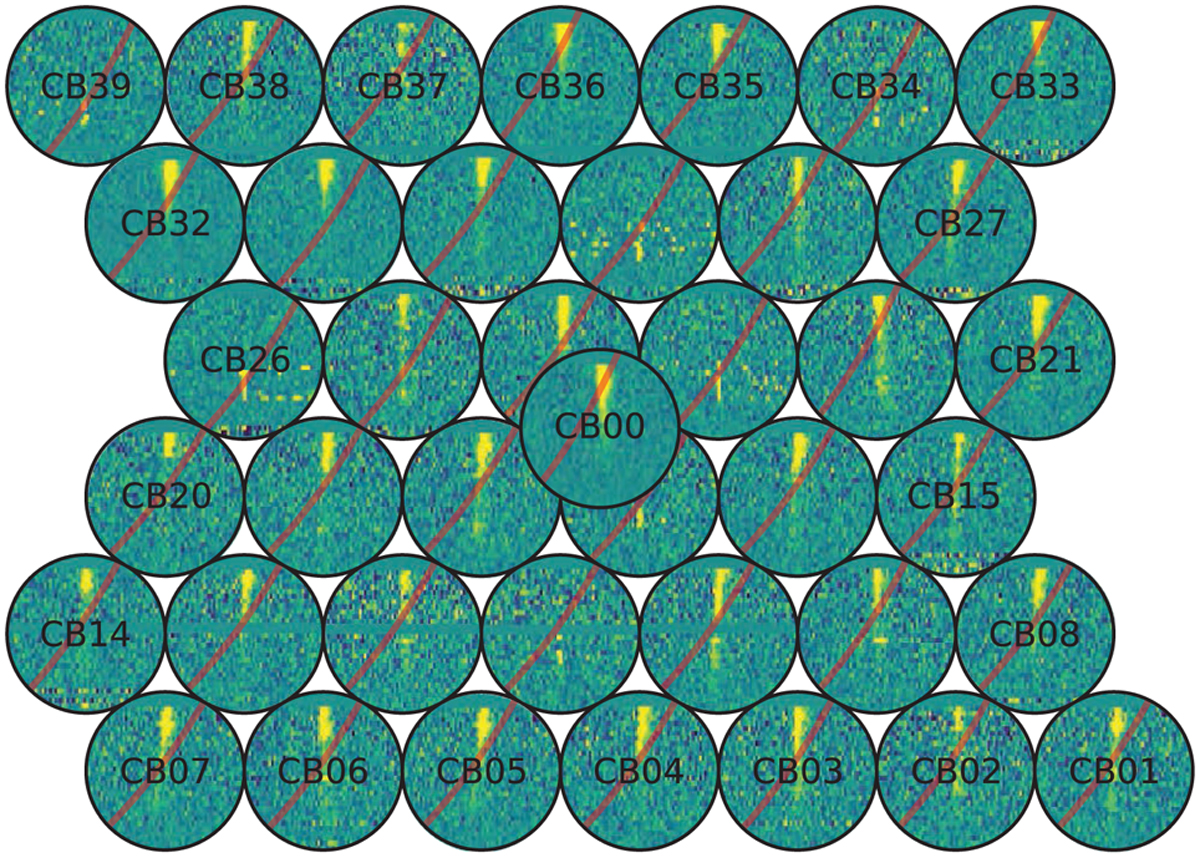
Peryton, detected in all 40 CBs (the circles). In each, the respective time-frequency plot is displayed (similar to, e.g., the bottom panel of Fig. 27), dedispersed to 395 pc cm−3. The vertical axis spans 300 MHz of bandwidth, the horizontal axis 500 ms of time. The red curve indicates the track a signal with DM = 0 pc cm−3 would have followed.
Current usage metrics show cumulative count of Article Views (full-text article views including HTML views, PDF and ePub downloads, according to the available data) and Abstracts Views on Vision4Press platform.
Data correspond to usage on the plateform after 2015. The current usage metrics is available 48-96 hours after online publication and is updated daily on week days.
Initial download of the metrics may take a while.