Fig. 7
Download original image
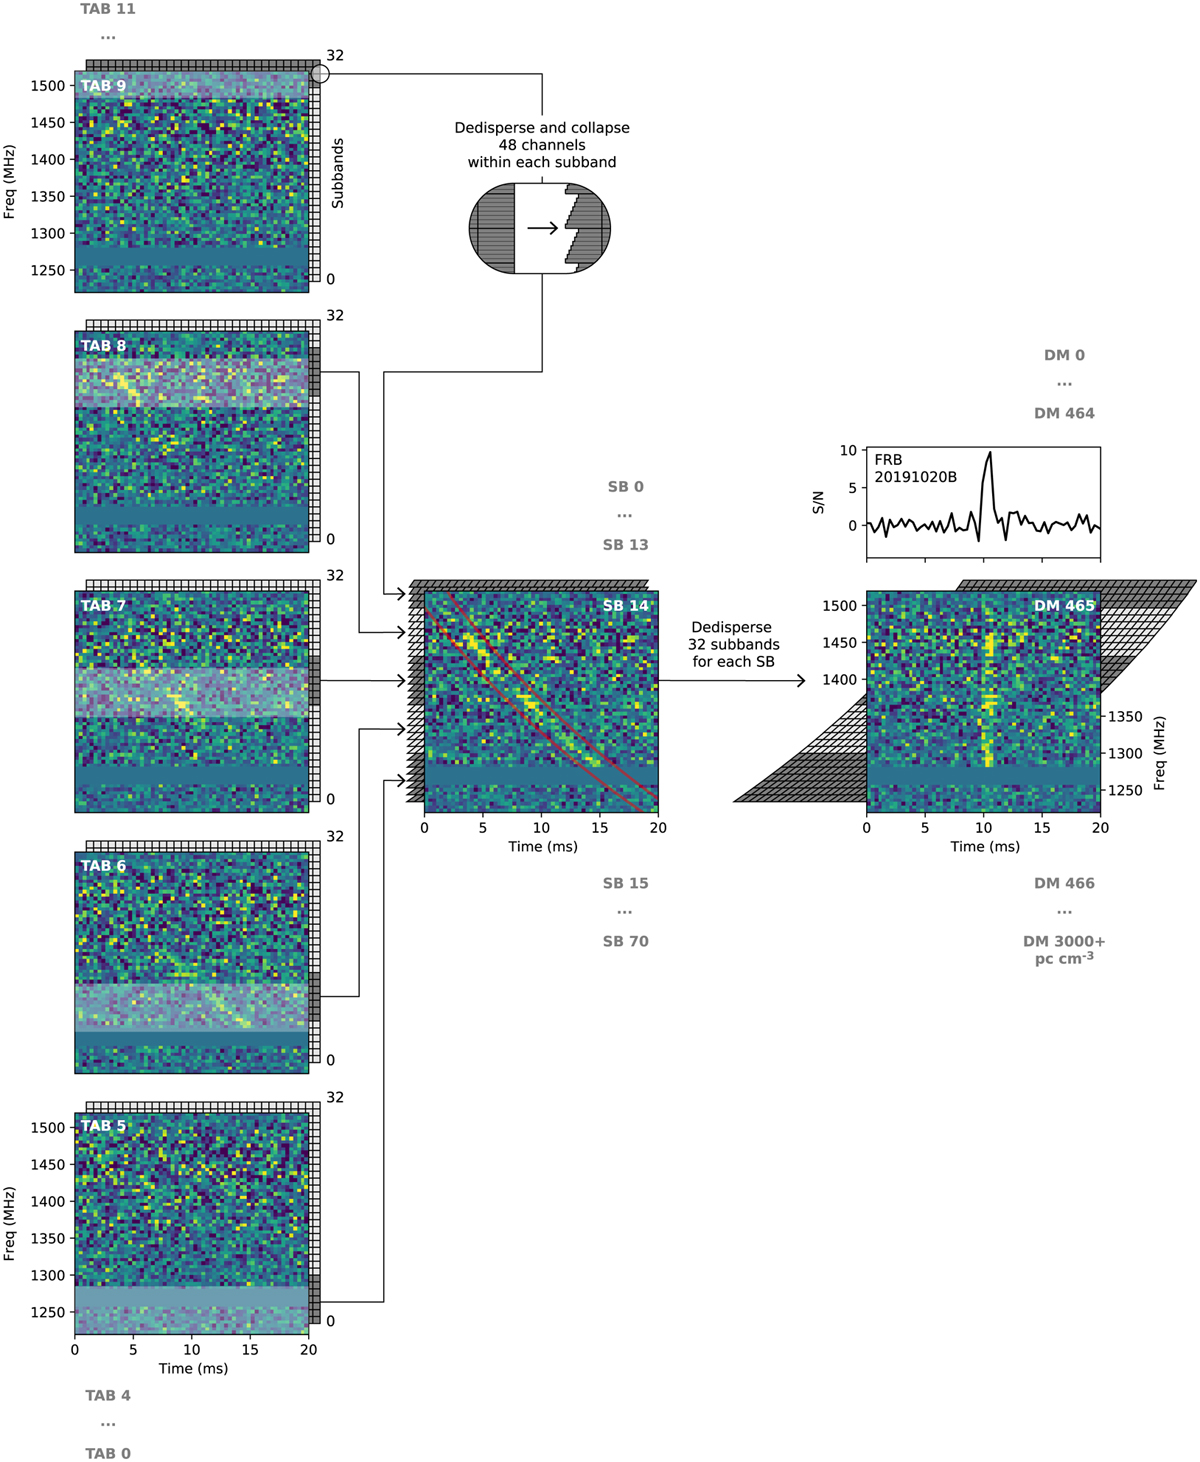
Formation of the SBs during subband dedispersion demonstrated through the detection of FRB 20191020B. Combinations of 12 TABs (left column) produce 71 SBs. The TABs are combined in units of subbands, each consisting of 48 channels. Each subband is first dedispersed to a coarse DM. For SB 14 the resulting intermediate time-frequency plot is shown in the centre. We show this step here for clarity but in the production implementation it is optimised out. For ease of visibility the FRB is shown here at a DM that is reduced by a factor 20. In the second step of dedispersion, the subbands are aligned over 32 trial DMs. FRB 20191020B was thus detected as shown on the right.
Current usage metrics show cumulative count of Article Views (full-text article views including HTML views, PDF and ePub downloads, according to the available data) and Abstracts Views on Vision4Press platform.
Data correspond to usage on the plateform after 2015. The current usage metrics is available 48-96 hours after online publication and is updated daily on week days.
Initial download of the metrics may take a while.