Fig. 3
Download original image
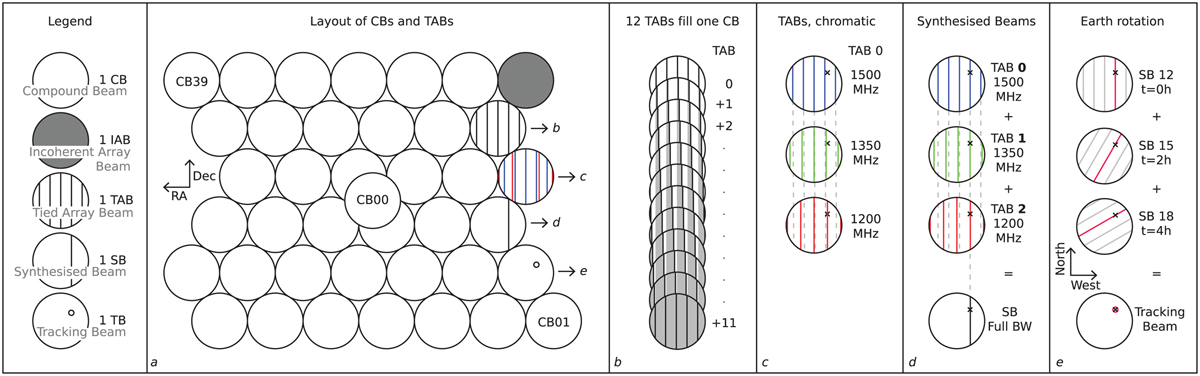
Overview of the beam hierarchy in ARTS. Panel (a) shows the 40 CBs formed by each PAF. The output signals of these CBs can be combined into IABs or coherent TABs, whose grating responses fill the entire CB as shown in panel (b). The frequency-dependence of these grating responses shown in panel (c) can be exploited to disambiguate them by combining signals from multiple TABs to form a SB as illustrated in panel (d). Finally, a TB can be formed towards a specific locus by combining multiple SBs over time as shown in panel (e).
Current usage metrics show cumulative count of Article Views (full-text article views including HTML views, PDF and ePub downloads, according to the available data) and Abstracts Views on Vision4Press platform.
Data correspond to usage on the plateform after 2015. The current usage metrics is available 48-96 hours after online publication and is updated daily on week days.
Initial download of the metrics may take a while.