Open Access
Fig. 2
Download original image
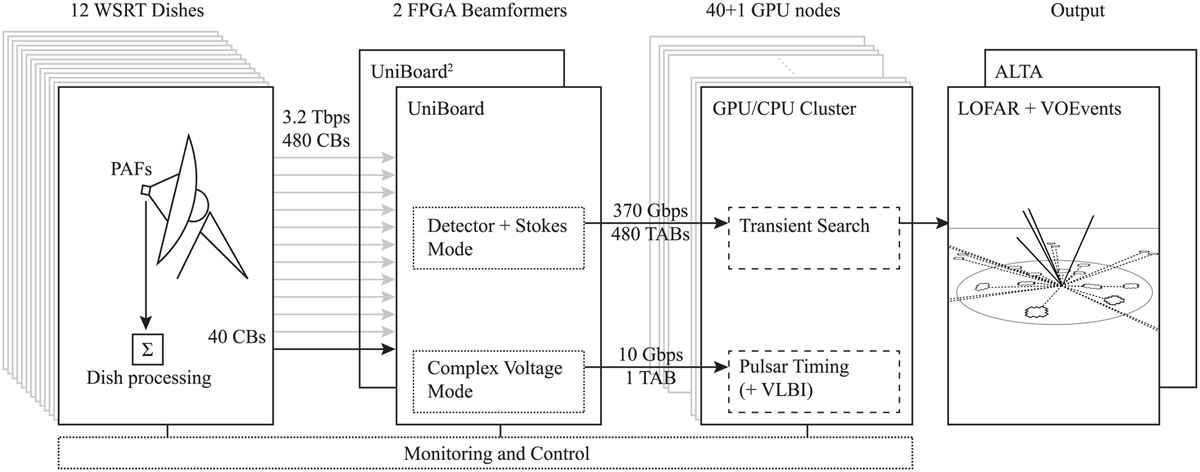
Top-level diagram for ARTS. Different line styles indicate different types of subsystems, each described in their own section. Full lines are hardware elements (Sect. 3). Dotted boxes depict firmware and software (Sect. 4). Dashed items are science pipelines (Sect. 5). The LOFAR and ALTA output are described in Sect. 11.
Current usage metrics show cumulative count of Article Views (full-text article views including HTML views, PDF and ePub downloads, according to the available data) and Abstracts Views on Vision4Press platform.
Data correspond to usage on the plateform after 2015. The current usage metrics is available 48-96 hours after online publication and is updated daily on week days.
Initial download of the metrics may take a while.