Fig. 18
Download original image
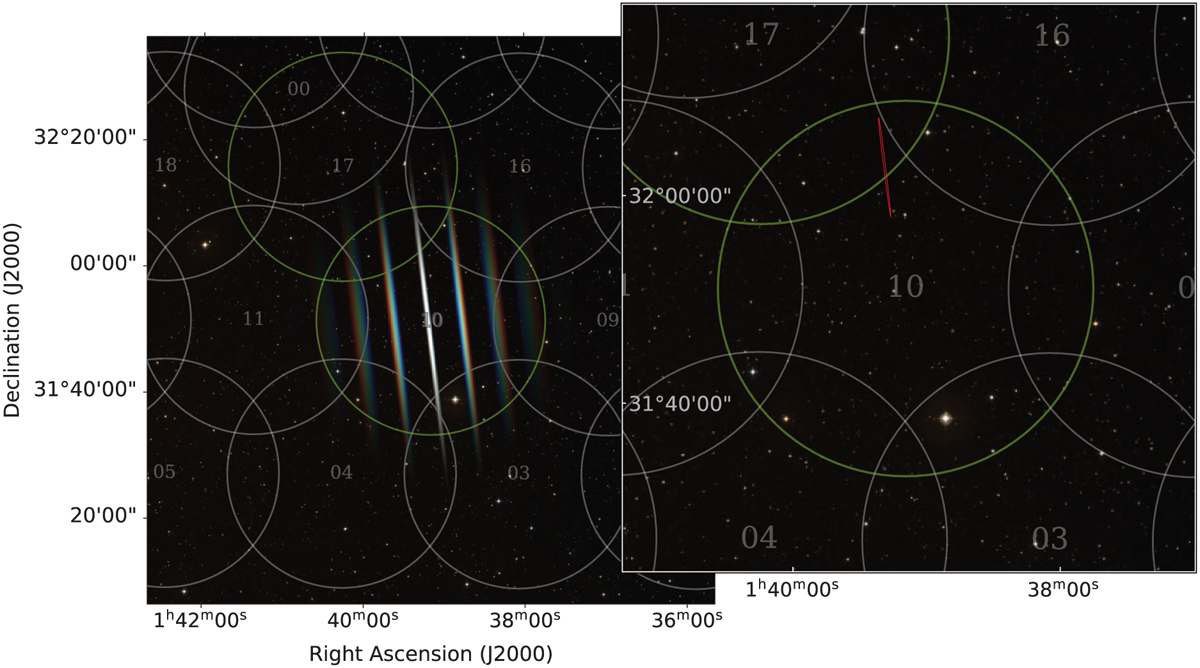
Localisation region of FRB 20190709A. In both panels, and in the localisation region figures that follow, the CBs at 1370 MHz are shown as white (non-detection) and green (detection) circles. In the left-hand side we show in the colour scale the simulated response of the SB in which the FRB was detected most strongly (cf. Fig. 12). On the right hand side, and in the follow figures, the red, elongated and very narrow area indicates the 90% confidence level localisation area that results from combining the SB detections and upper limits of all surrounding CBs. Background image here and in the following figures are from the Sloan Digital Sky Survey (SDSS; York et al. 2000).
Current usage metrics show cumulative count of Article Views (full-text article views including HTML views, PDF and ePub downloads, according to the available data) and Abstracts Views on Vision4Press platform.
Data correspond to usage on the plateform after 2015. The current usage metrics is available 48-96 hours after online publication and is updated daily on week days.
Initial download of the metrics may take a while.