Fig. 12
Download original image
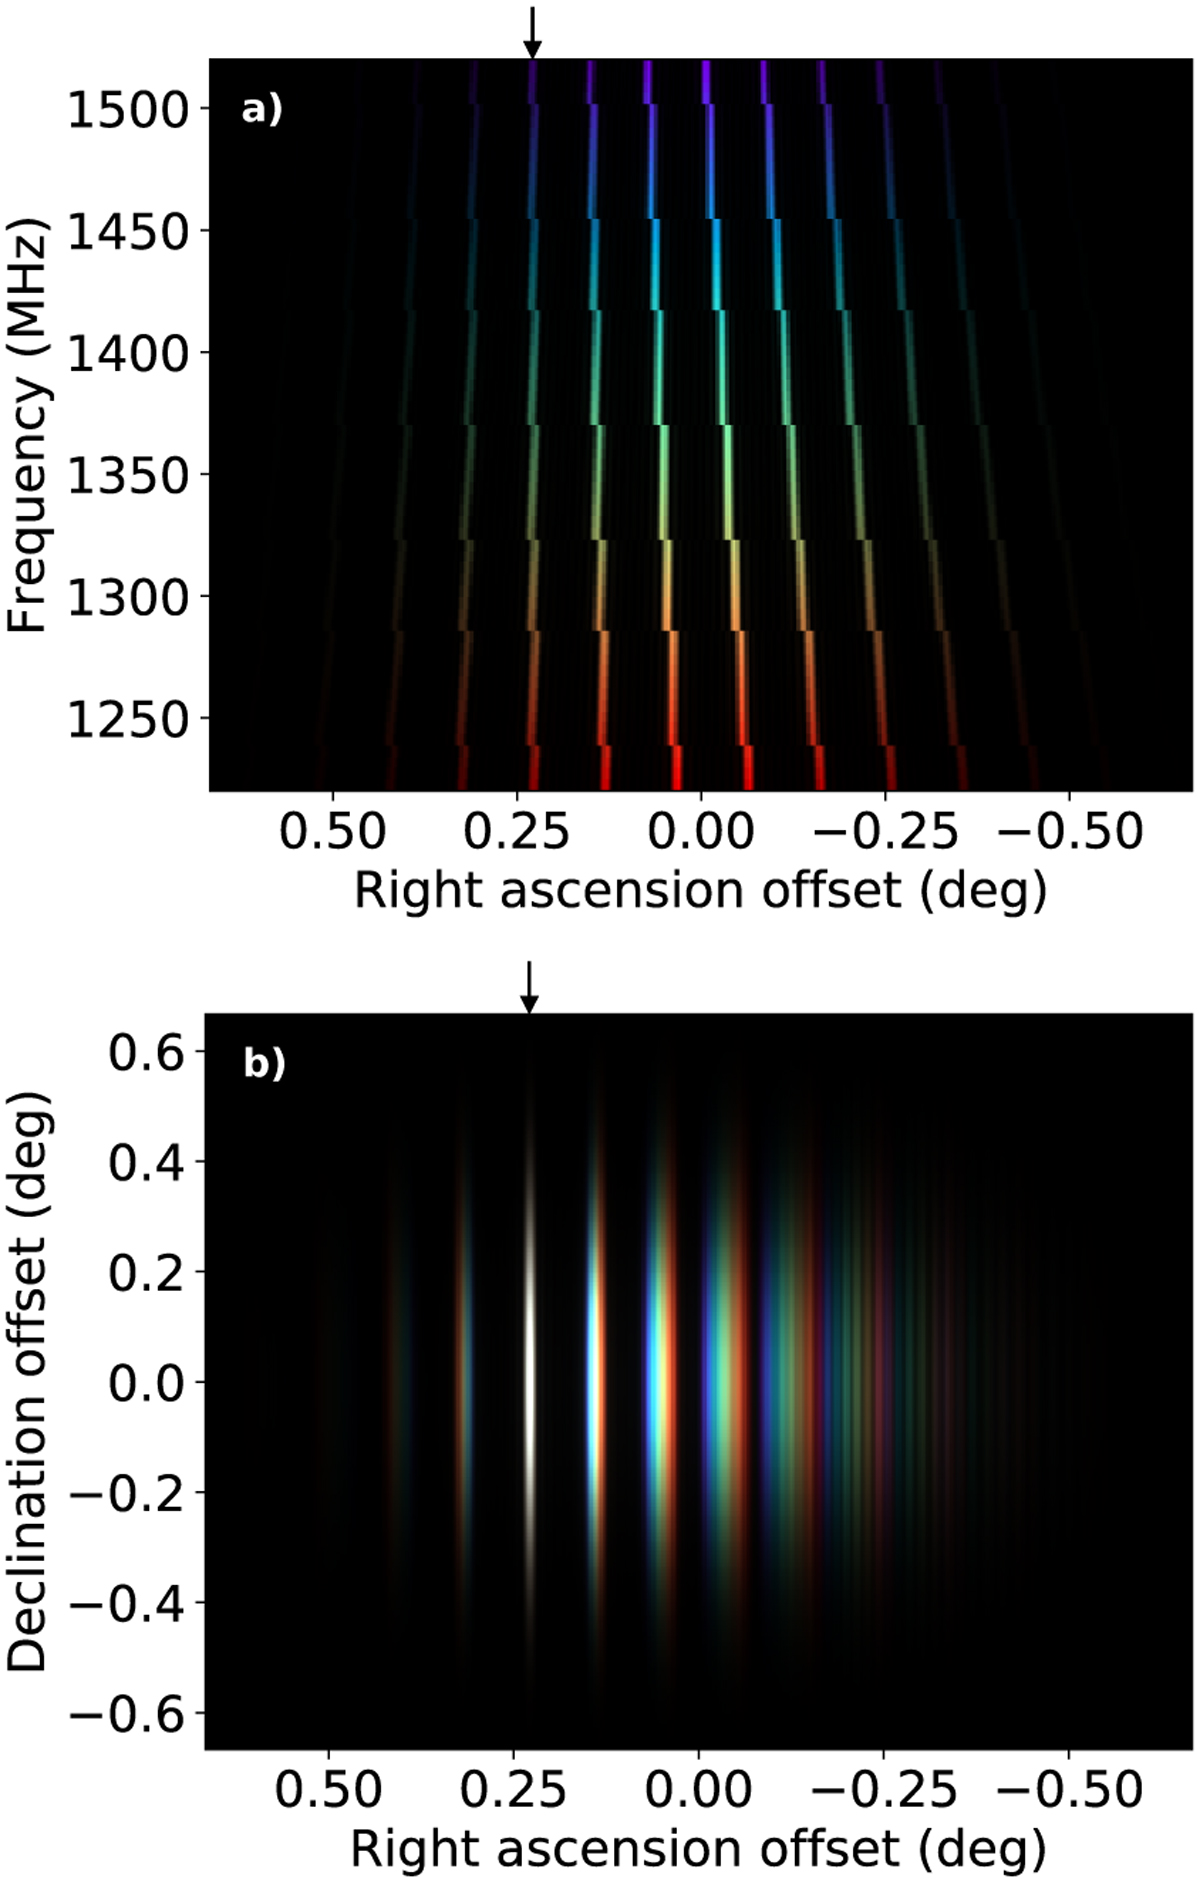
Model of outermost synthesized beam 70: in (a), as a function of RA and frequency. The intended main beam is indicated with an arrow. The discontinuities in the sidelobes occur when the beamforming switches to a different TAB. In (b), as function of RA and Dec. The colours indicate frequency, where white means an SB is sensitive over the full frequency range. Only the main beam in (b) is broadband, the sidelobes are not.
Current usage metrics show cumulative count of Article Views (full-text article views including HTML views, PDF and ePub downloads, according to the available data) and Abstracts Views on Vision4Press platform.
Data correspond to usage on the plateform after 2015. The current usage metrics is available 48-96 hours after online publication and is updated daily on week days.
Initial download of the metrics may take a while.