Fig. 4
Download original image
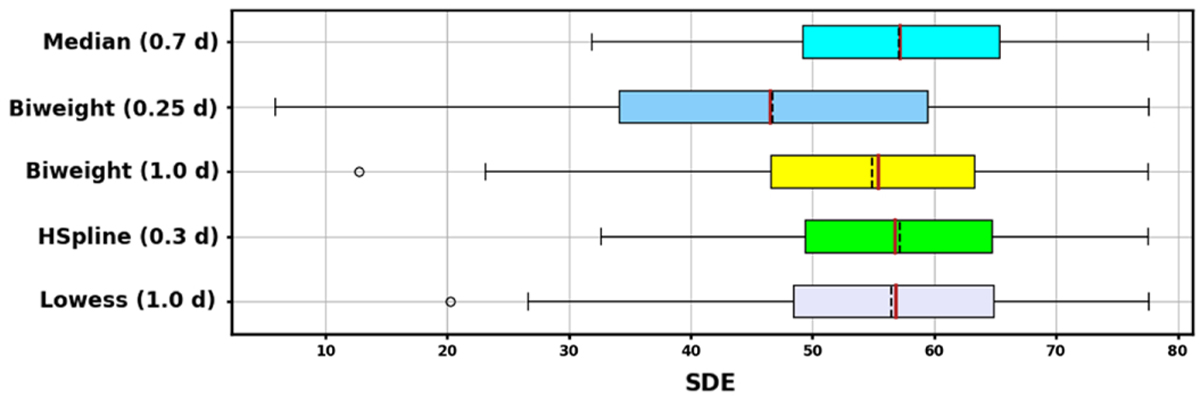
Boxplot of the signal detection efficiency for the general-purpose algorithms from Wōtan tested on the active sample with injected transit signals with Rp ~ 0.5 RJ and Porb ∈ [1–15] days, moving on circular orbits. Boxes cover the lower to upper quartiles; whiskers show the 10 and 90 percentiles. Dashed black lines indicate the mean SDE, whereas red lines the median. The black circles in the biweight (1.0 day) and the lowess (1.0 day) cases represent data that extend beyond the whiskers.
Current usage metrics show cumulative count of Article Views (full-text article views including HTML views, PDF and ePub downloads, according to the available data) and Abstracts Views on Vision4Press platform.
Data correspond to usage on the plateform after 2015. The current usage metrics is available 48-96 hours after online publication and is updated daily on week days.
Initial download of the metrics may take a while.