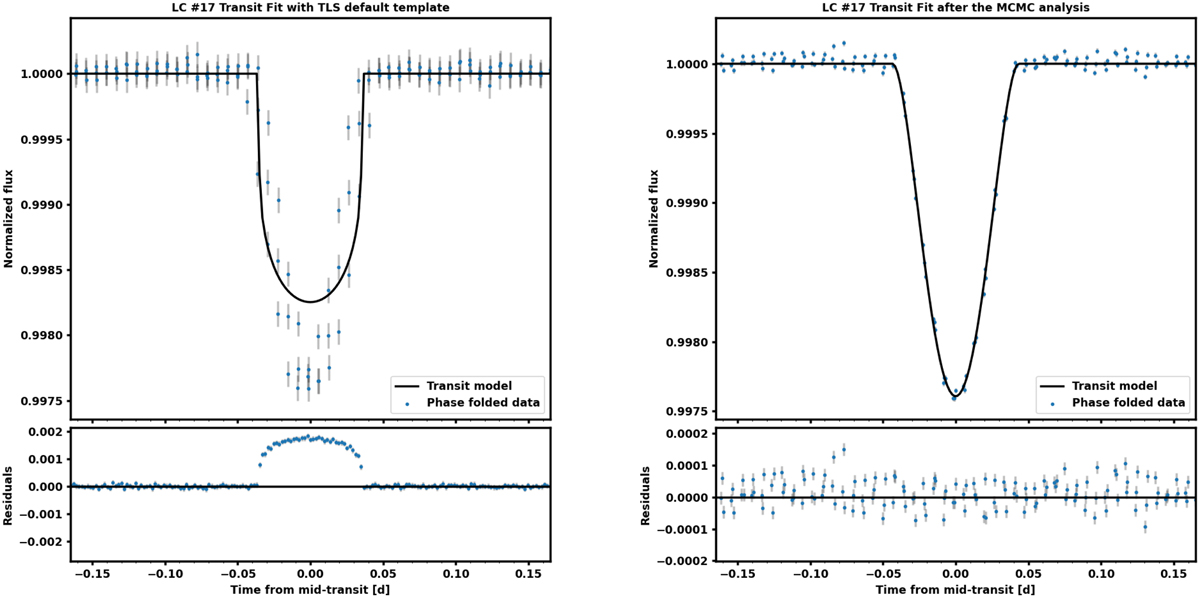
Fig. A.2
Download original image
Transit fit of the first quarter of LC #17 with a large injected planet. Top panel: Best fit of the transit light curve is represented by the solid black line, whereas the blue points are the PLATO normalized data, as a function of the time from mid-transit. Bottom panel: Residuals (O-C: observed data-calculated data) are shown as a function of the time from mid-transit. Left: Transit model computed with TLS default template. Right: Transit model computed after an MCMC analysis.
Current usage metrics show cumulative count of Article Views (full-text article views including HTML views, PDF and ePub downloads, according to the available data) and Abstracts Views on Vision4Press platform.
Data correspond to usage on the plateform after 2015. The current usage metrics is available 48-96 hours after online publication and is updated daily on week days.
Initial download of the metrics may take a while.