Fig. 15
Download original image
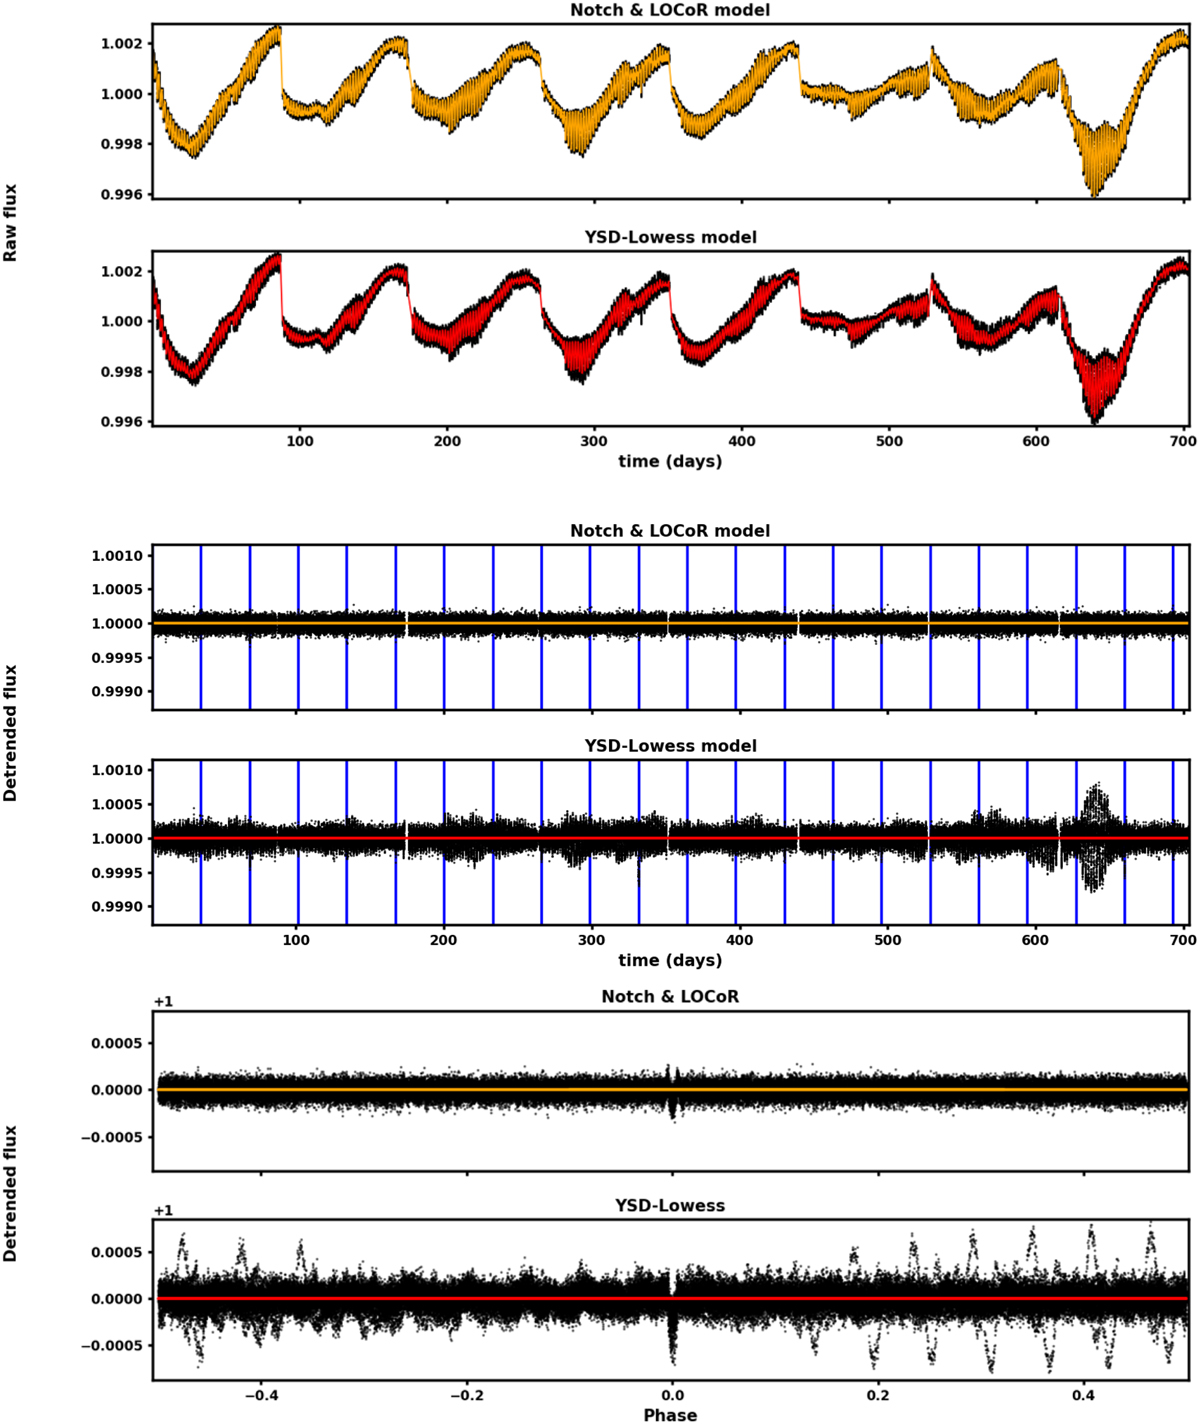
Raw flux (upper panel), detrended flux (middle panel), and phase-folded flux (lower panel) of the LC #58 of the sample of active stars with injected a transit signal with Porb = 32.83 days and Rp/R* = 0.015. Data points are shown in black, whereas different colors represent the photometric variability model inferred from algorithm: N&L (orange) and YSD (red). The transit is undetected in the former case, while it is detected with SDE = 25 in the latter case. Blue vertical lines mark the mid-transit time.
Current usage metrics show cumulative count of Article Views (full-text article views including HTML views, PDF and ePub downloads, according to the available data) and Abstracts Views on Vision4Press platform.
Data correspond to usage on the plateform after 2015. The current usage metrics is available 48-96 hours after online publication and is updated daily on week days.
Initial download of the metrics may take a while.