Fig. 10
Download original image
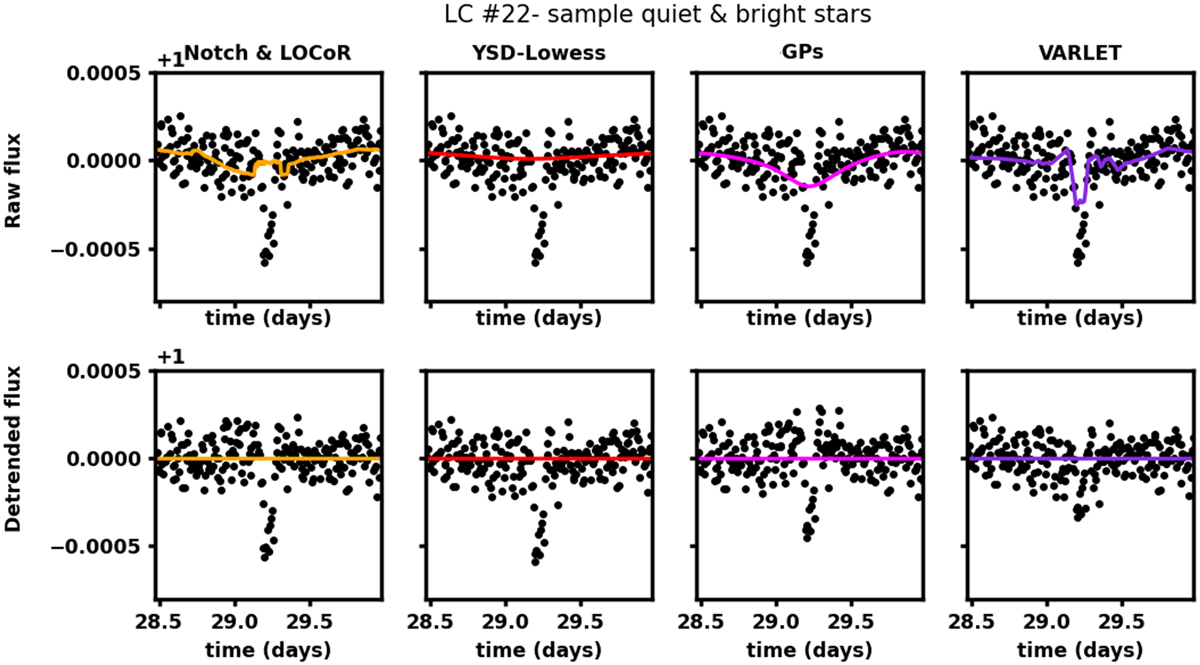
Raw flux (top) and detrended flux (bottom) of the first quarter of LC #22 of the quiet sample, zoomed in on the transit points of the injected Earth-size planet. Data points are shown in black, whereas different colors represent the photometric variability model inferred from different algorithms: N&L (orange), YSD (red), GPs (fuchsia), and VARLET (violet).
Current usage metrics show cumulative count of Article Views (full-text article views including HTML views, PDF and ePub downloads, according to the available data) and Abstracts Views on Vision4Press platform.
Data correspond to usage on the plateform after 2015. The current usage metrics is available 48-96 hours after online publication and is updated daily on week days.
Initial download of the metrics may take a while.