Open Access
Fig. 1
Download original image
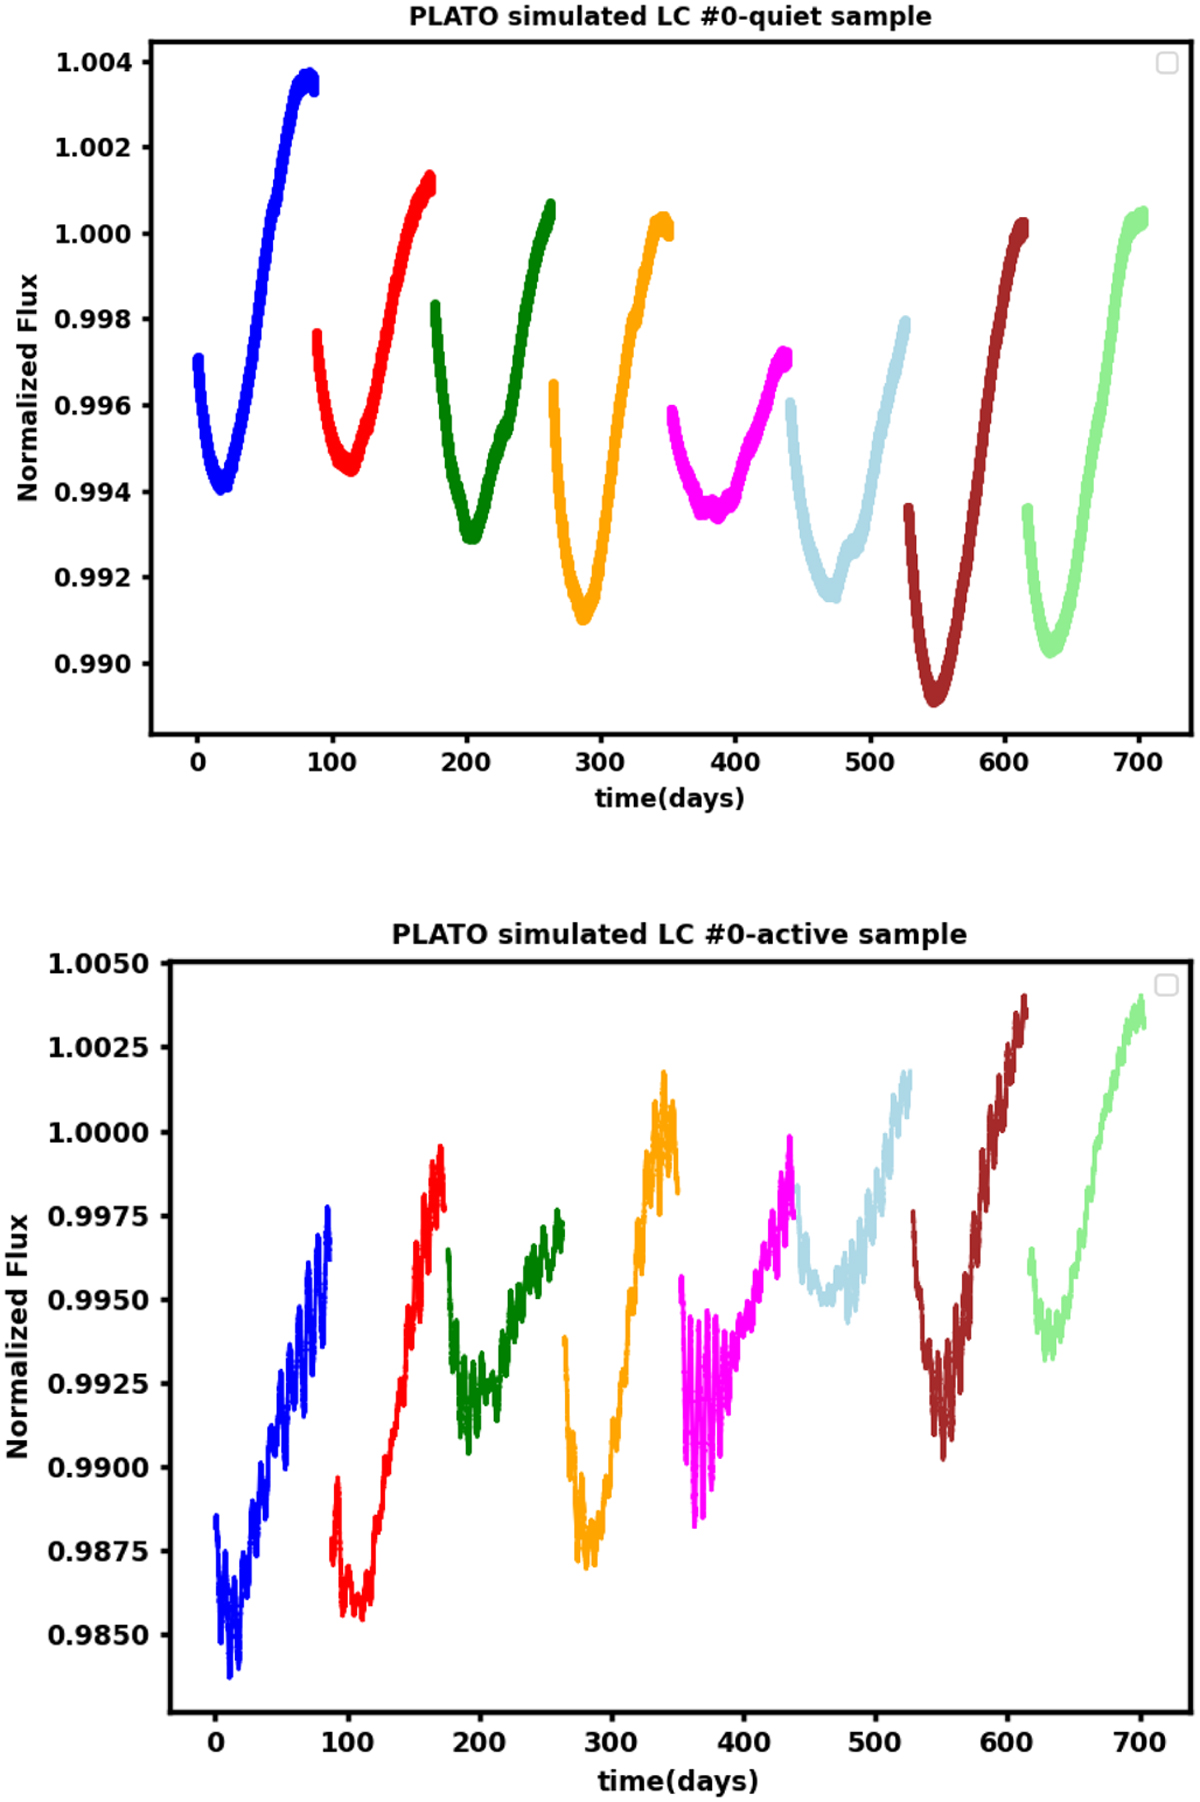
PLATO simulated LC #0 of the sample of quiet stars (top) and active stars (bottom). Different colors represent different quarters. The systematics in the simulated LCs represent a worst-case scenario, as their correction will be addressed in the final PLATO data products.
Current usage metrics show cumulative count of Article Views (full-text article views including HTML views, PDF and ePub downloads, according to the available data) and Abstracts Views on Vision4Press platform.
Data correspond to usage on the plateform after 2015. The current usage metrics is available 48-96 hours after online publication and is updated daily on week days.
Initial download of the metrics may take a while.