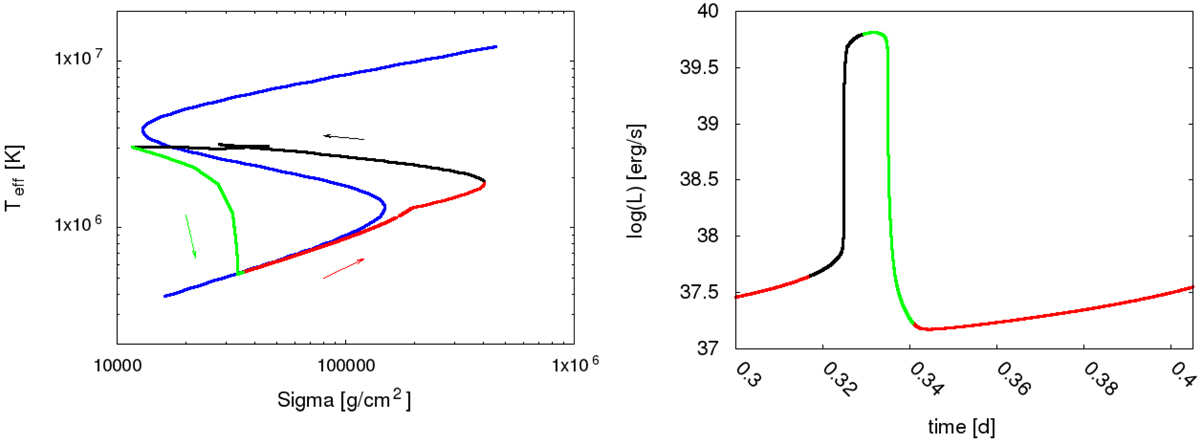
Fig. 5.
Download original image
Illustration of the limit cycle instability in the accretion disk. Left panel: local stability curve (blue line). The outburst cycle for a black hole mass 10 M⊙ and R = 40Rschw for a base model without RADAF and Rout = 300Rschw is indiated. Right panel: exemplary fragment of the disk light curve. The cycle steps are indicated for a black hole mass 10 M⊙. The following steps of the cycle are colored: the black part of the light curve represents the heating phase, the green part shows the advective phase, and the red part represents the diffusive phase. The colored arrows indicate the direction of the cycle anticlockwise.
Current usage metrics show cumulative count of Article Views (full-text article views including HTML views, PDF and ePub downloads, according to the available data) and Abstracts Views on Vision4Press platform.
Data correspond to usage on the plateform after 2015. The current usage metrics is available 48-96 hours after online publication and is updated daily on week days.
Initial download of the metrics may take a while.